- Title
-
Neuropeptides: developmental signals in placode progenitor formation
- Authors
- Lleras-Forero, L., Tambalo, M., Christophorou, N., Chambers, D., Houart, C., and Streit, A.
- Source
- Full text @ Dev. Cell
|
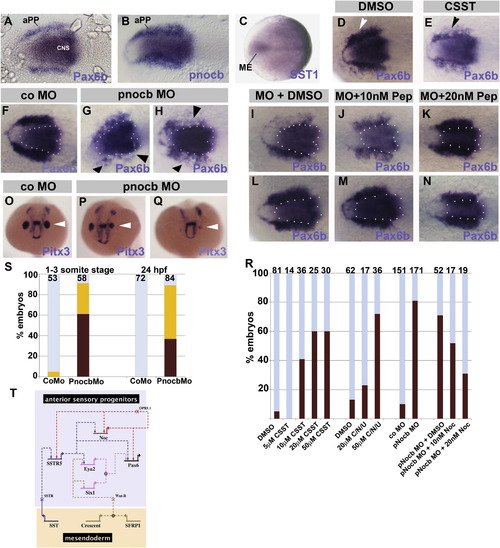
SST and Noc Control aPPs in Zebrafish (A–C) Expression of Pax6b (A), pnocb (B), and SST1 (C) in zebrafish at early somite stages: dorsal views, anterior to the left. (D and E) Pax6b reduction by CSST (E; arrowhead), but not by DMSO (D; white arrowhead). (F–H) Embryos were injected with control (F) or pnocb MOs (G and H); the latter show Pax6b reduction (arrowheads in G and H). Dotted lines indicate CNS expression of Pax6b. (I–N) pnocb ATG (I–K) or control (L–N) MO-injected embryos were incubated in DMSO (I and L) or Noc peptide (J, K, M, and N). Dotted lines indicate CNS Pax6b expression. (O–Q) Embryos were injected with control (O) or pnocb MOs (P and Q). At 24 hpf (frontal views), Pitx3 expression reveals asymmetric, small (P; arrowhead) or almost absent lenses (Q; arrowhead). (R) Graph shows Pax6b reduction after SST inhibition, SST and Noc inhibition, in Noc morphants and Noc morphants + Noc peptide. Numbers for each treatment are at the top. Brown bars indicate embryos with phenotype, blue bars show normal embryos. (S) Quantification of pnocb morphants with Pitx3 reduction (yellow) or loss (brown) at early somite stages or 24 hpf. (T) Model for neuropeptide function. |
Reprinted from Developmental Cell, 26(2), Lleras-Forero, L., Tambalo, M., Christophorou, N., Chambers, D., Houart, C., and Streit, A., Neuropeptides: developmental signals in placode progenitor formation, 195-203, Copyright (2013) with permission from Elsevier. Full text @ Dev. Cell

