- Title
-
ETS Factors Regulate Vegf-Dependent Arterial Specification
- Authors
- Wythe, J.D., Dang, L.T., Devine, W.P., Boudreau, E., Artap, S.T., He, D., Schachterle, W., Stainier, D.Y., Oettgen, P., Black, B.L., Bruneau, B.G., and Fish, J.E.
- Source
- Full text @ Dev. Cell
|
Identification of an Intronic Enhancer of Dll4 that Drives Arterial-Specific Expression (A) Conservation between murine and opossum Dll4 with location of fragment 1 (F1) and F2 indicated. Transgenic analysis of F1-lacZ and F2-hsp68-lacZ (E9.5) is below. Further analysis of F1-lacZ is shown in Figures S1A and S1B. (B) In situ hybridization of endogenous Dll4 (top) and expression in Dll4lacZ/+ (middle) and a stable Dll4-F2-hps68-lacZ (F2) reporter line (bottom). Dorsal aorta (arrows). (C) F2 expression in early arterial precursors (aPCs) and in cardiac crescent (CC). NT, neural tube. (D) Transverse sections of F2 expression. DA, dorsal aorta (arrow); CV, cardinal vein (caret). (E) A stable Dll4-F2-E1b:GFP transgenic zebrafish line demonstrates arterial-specific expression. kdrl:ras-mCherry marks all blood vessels. CA, caudal artery; CVP, caudal vein plexus; ISV, intersomitic vessel; DLAV, dorsal longitudinal anastomotic vessel. (F) Cross-section of axial vasculature of F2:GFP zebrafish. PCV, posterior cardinal vein. Scale bars represent 500 μm (B), 100 μm (D), 50 μm (E), and 10 μm (F). See also Figure S1. |
|
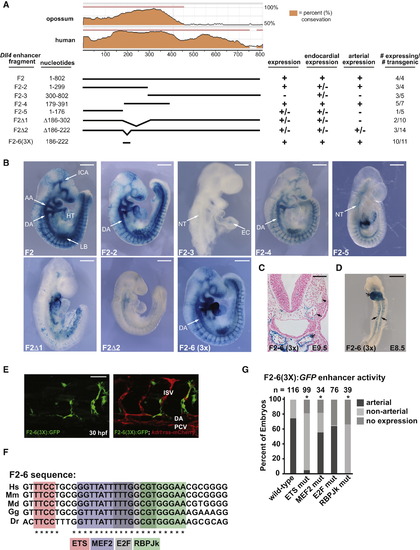
Isolation of a Minimal Dll4 Enhancer Element that Drives Arterial-Specific Expression (A) Sequence conservation of the F2 enhancer and deletion constructs used in transgenic analyses. Endocardial and arterial expression is indicated. (B) Representative transgenic embryos from (A) at E9.5. F2, F2-2, and F2-4 directed strong arterial-specific expression. F2-3 directed weak endocardial (EC) expression. Deletion of a highly conserved 100 bp and 36 bp region (F2Δ1 and F2Δ2, respectively) abrogated arterial activity of the F2 enhancer. The 36 bp region, F2-6, was sufficient, when arrayed in triplicate, F2-6(3X), to direct arterial expression. DA, dorsal aorta; AA, aortic arch; LB, limb bud; NT, neural tube; ICA, internal cerebral artery; HT, heart. Scale bar represents 500 μm. (C) Transverse section of X-gal stained F2-6(3X)-lacZ embryo at E9.5. DA (arrow); cardinal vein (caret); EC (double arrow). Scale bar represents 100 μm. (D) Whole-mount image of F2-6(3X)-lacZ embryo at E8.5. Scale bar represents 500 μm. (E) Mosaic expression of F2-6(3x):GFP in the DA and intersomitic vessels (ISVs) of a transient transgenic 30 hpf zebrafish embryo. PCV, posterior cardinal vein. Scale bar represents 50 μm. (F) Sequence comparison of F2-6 in human (Hs), mouse (Mm), opossum (Md), chicken (Gg), and zebrafish (Dr). Cis elements are indicated. (G) Each cis element was mutated in F2-6(3X):GFP and transient transgenics were assessed for arterial expression at 24 hpf. The percentage of embryos with expression in arteries (i.e., DA and/or ISV), expression elsewhere, and no expression, are indicated. Asterisk indicates a significant difference in arterial expression compared to wild-type (χ2 test). See also Figure S2. |
|
Notch Signaling Is Not Required for Early Arterial Expression of Dll4 (A) Transient transgenesis of wild-type F2:GFP compared to a RBPJk mutant construct (F2ΔRBPJk:GFP). DA, dorsal aorta; PCV, posterior cardinal vein; ISV, intersomitic vessel. (B) Whole-mount images (left), and transverse sections (right) of wild-type and RBPJk-mutated F2-lacZ transgenic embryos. (C) Expression of F2:GFP in control and rbpjk morphant (MO) embryos, demonstrating normal enhancer activity in the DA (arrow) at 20 somites, but decreased expression at 26 hpf. Expression of kdrl:GFP in the DA was unaffected. (D) F2-lacZ expression was reduced but present in the DA of Rpbjk-/- embryos at E8.5 (Rpbjk+/+, n = 25; Rpbjk-/-, n = 5) and E8.25 (Rpbjk+/+, n = 14; Rpbjk-/-, n = 4). (E) F2-lacZ expression was normal at E8.5 (left), and at E9.5 in whole-mount (center) and transverse sections (right) from embryos with endothelial cell-specific loss (ECKO) of Rbpjk, although mutants had a reduced DA diameter (bar) at E9.5, as previously reported (Krebs et al., 2004) E9.5, Rpbjkdel/fl, n = 6; RpbjkECKO, n = 4; E8.5, Rpbjkdel/fl, n = 8; RpbjkECKO, n = 3. (F) In situ hybridization shows that Rbpjk is not absolutely required for Dll4 expression at E8.5 (n = 3 for each genotype). DA, arrows; asterisk, neural tube. Scale bars represent 50 µm (A and C), 500 μm for whole-mounts, and 100 μm for sections (B and D–F). See also Figure S2. |
|
Dll4 Is Regulated by ETS Factors (A) Representative images (left) and quantification (right) of wild-type, ETS-B, and ETS-6x mutant F2:GFP embryos at 48 hpf. ISV, intersomitic vessel; DA, dorsal aorta; PCV, posterior cardinal vein. Asterisk indicates a significant difference in arterial expression compared to wild-type (χ2 test). (B) Expression of endogenous DLL4 in HUVEC electroporated with ETV2 or ERG expression constructs (n = 3, ETV2; n = 5, ERG). (C) V5-ERG expression in electroporated HUVEC (left). ChIP in V5-ERG-electroporated HUVEC. Fold enrichment (V5 versus IgG) was measured at the Dll4 enhancer (intron 3) and Dll4 exon 11 (n = 2). (D) ChIP in BAEC for RNA Polymerase II (RNA Pol II), ERG or the Notch intracellular domain (NICD) (n = 3). Asterisk indicates significant enrichment over IgG control. (E) Expression of F2:GFP (arterial) and kdrl:GFP (pan-endothelial) in erg;fli1a morphants. Representative images (left) and quantification (n = 5–10) (right). (F) Endogenous dll4, ephrinb2a, hey2, and kdr in control and erg;fli1a morphants assessed by qPCR (n = 5–10 individual embryos). (G) Notch activity (Tp1:GFP) was diminished in the dorsal aorta of <30% of erg/fli1a morphants. (H) Levels of arterial markers and a pan-endothelial marker (Pecam1) were quantified by qRT-PCR in E8.5 embryos (n = 3 for wild-type, n = 2 for ErgΔEx4/ ΔEx4 embryos). (I) Endogenous Dll4 mRNA is downregulated in the DA of ErgΔEx4/ ΔEx4 embryos (arrows; n = 3 embryos per genotype) at E9.5. (J) Efnb2 section in situ hybridization at 9.5 shows downregulation of Efnb2 in the DA (arrows) of ErgΔEx4/ ΔEx4 embryos (Erg+/+, n = 3; ErgΔEx4/ ΔEx4 n = 2). Scale bars represent 50 μm (A, E, and G), 500 μm (I), 100 μm (J). All graphical data are mean ± SEM. See also Figures S3 and S4. |
|
Vegf Regulates the Dll4 Enhancer through an ETS Element (A) Expression of F2:GFP (arterial) and kdrl:GFP (pan-endothelial) in control or vegfa morphant embryos. Lateral dorsal aorta (arrows); dorsal aorta (DA). Scale bar represents 50 μm. (B) Quantification of GFP intensity in the DA (n e 10 per group). (C) Expression (qRT-PCR) of dll4 (arterial), kdr, and kdrl (pan-endothelial) in control and vegfa morphant embryos (n e 3 per group). (D) Overexpression of Vegfa enhanced expression of F2:GFP in arterial cells and expanded expression to venous cells. CA, caudal artery; CVP, caudal vein plexus. Quantification is shown (n = 6–8 embryos per group). Scale bar represents 50 μm. (E) Expression of DLL4 (qRT-PCR) in BAECs treated with VEGF or VEGF receptor inhibitor (SU5416) for 24 hr (n = 3). (F) Relative F2:luciferase activity in BAEC treated with VEGF or SU5416. A representative experiment with three technical replicates is shown. Asterisk indicates a significant difference in luciferase activity compared to all other constructs. Number sign (#) indicates a significant difference between RBPJk MT and ETS-B MT, 6x-ETS MT and RBPJk/ETS-B MT. (G) ChIP assays for RNA Pol II and ERG in BAEC treated with VEGF or SU5416 for 24 hr (n = 3). (H) Western blotting demonstrating equal expression of ERG protein in BAECs treated with VEGF or SU5416 for 24 hr. (I) Intracellular localization of ERG was unchanged by VEGF treatment. Scale bar represents 20 μm. (J) Expression of ERG was elevated in arterial cells (HUAEC) compared to venous cells (HUVEC). All graphical data are mean ± SEM. See also Figure S5. |
|
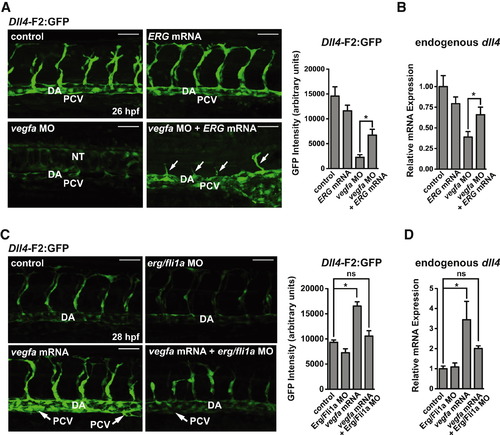
ETS Factors Act Downstream of Vegf to Induce dll4 Expression (A) ERG mRNA (200 pg) injection partially rescued F2:GFP expression and sprouting (arrows) in vegfa morphants at 26 hpf. Representative images (left) and quantification (right, n = 10–12). (B) dll4 mRNA expression (normalized to kdr expression) was assessed by qRT-PCR in individual 26 hpf embryos injected with ERG mRNA and/or vegfa morpholino (n = 4). (C) Partial knockdown of erg and fli1a with a sub-phenotypic dose of morpholino inhibited the induction of F2:GFP expression in both the dorsal aorta (DA) and posterior cardinal vein (PCV) in Vegfa121/165 mRNA-injected embryos. Arrows indicate collapsed PCV. Quantification of 10–13 embryos per group is shown. (D) Endogenous dll4 mRNA was assessed by qRT-PCR in individual embryos at 24 hpf (n = 5). All graphical data are mean ± SEM. See also Figure S6. |
|
Wnt/β-Catenin signaling is not active in early arteries and does not regulate early Dll4 expression. (A) Conservation between murine and opossum Dll4 with location of fragment 1 (F1) indicated. Transgenic analysis of F1-lacZ (E9.5) is below. (B) Representative whole-mount F1-lacZ transgenic embryo. (C) Wholemount (left) and transverse sections (right) of BAT-gal embryos at E8.5 (n=5) and E9.5 (n=4). Dorsal aorta (arrow); cardinal vein (caret). (D) Whole-mount (left) and zoomed-in (right) Axin2-d2EGFP embryos at E8.5 (n=6) and E9.5 (n=8). (E) Whole-mount (left) and transverse sections (right) of Axin2nlacZ/+ embryos at E8.5 (n=3) and E9.5 (n=5). (F) Vascular patterning in endothelial-specific Ctnnb1 (β-catenin) loss-of-function (ECKO) embryos was normal, as visualized by Cre-mediated recombination of a GFP reporter allele (Rosa26-mTomato-lox-stop-lox-mGFP [mTmG]) (left). The dorsal aorta (arrow) and cardinal vein (caret) are indicated. A zoomed-in view (right) of the brain vasculature demonstrates a less remodeled vascular plexus (indicated by arrows) in the ECKO (n=7) embryonic brain compared to control (n=10) embryos. (G) Dll4 in situ hybridization indicates normal expression in the dorsal aorta (arrow) of Ctnnb1 ECKO embryos (n=4). (H) No defects in arteriovenous morphology in Ctnnb1 null (n=5) embryos were observed, as assessed by ink injection (as ink filled the entire dorsal aorta (arrows)) and H&E histology of serial cross-sections through the rostral and caudal planes of the dorsal aortae and cardinal veins. Dorsal aorta (arrow); cardinal vein (caret). Scale bars: 500 μm (B-H, whole-mount), 100 μm (C-H, sections and zoom ins). |
|
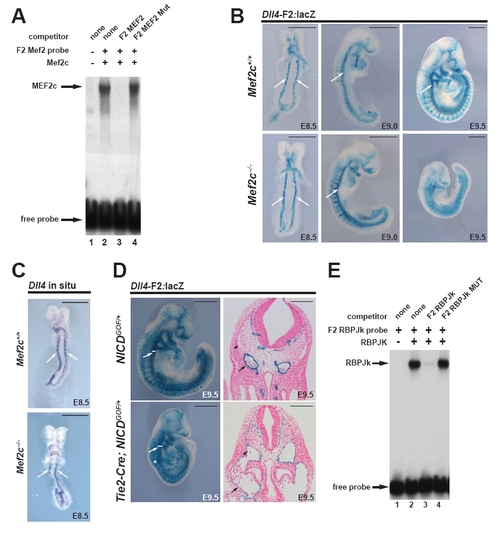
(Related to Figure 3): MEF2C and RBPJk bind to the F2 enhancer, and overexpression of NICD in the endothelium can drive F2 expression in the vein, while MEF2C is dispensable for early arterial Dll4 expression. (A) Recombinant MEF2C protein was used in an electrophoretic mobility shift assay (EMSA) with a radiolabelled double-stranded oligonucleotide representing the F2-6 MEF2 binding site. Lane 1 contains reticulocyte lysate without recombinant MEF2C (represented by a minus sign). MEF2C efficiently bound to the F2-6 MEF2 site (lane 2) and this binding was efficiently competed by an excess of the unlabeled wild type F2-6 MEF2 element (lane 3), but not by an excess of a mutant form of this site (lane 4). (B) The F2-lacZ enhancer was crossed into the Mef2c+/- background, and wild-type and homozygous mutant embryos were stained for X-gal at E8.5, 9.0, and E9.5. No difference in enhancer activity was observable in mutant embryos compared to wild-type (Mef2c+/+) littermates at early stages of vascular development (i.e. E8.5-E9.0) (n e 5 for each genotype). The dorsal aorta is indicated by arrows. Scale bars = 500 μm (C) Expression of Dll4 mRNA was examined by in situ hybridization in Mef2c+/+ and Mef2c-/- embryos. No difference in expression was noted at E8.5 (n=3 for each genotype). Scale bars = 500 μm (D) NICD was over-expressed in the endothelium via Tie2-Cre-mediated activation of a R26N1ICD allele. Whole-mount images (left; scale bar = 500 μm) and sections (right; scale bar = 100 μm) are shown. The presence of an arteriovenous malformation (AVM) is indicated by an asterisk and the dorsal aorta (arrow) and cardinal vein (caret) are also indicated. Expression of F2 was expanded into the cardinal vein in Notch over-expression embryos. (E) EMSA showing RBPJk binding to a probe corresponding to the F2-6 RBPJk site. Binding was competed by an excess of unlabeled wild-type but not RBPJk mutant probe. |
|
Figure S3 (Related to Figure 4): The Dll4 F2 enhancer contains multiple ETS binding sites. (A) ClustalW analysis of the 802-bp Dll4 F2 evolutionarily conserved region (ECR), comparing mouse, human, and opossum sequences. The region contains 9 perfectly conserved ETS consensus (GGA(A/T)) sequences (red boxes). Murine F2 contains a total of 14 ETS sites, with five more non-conserved sites (blue boxes). The minimal 36-bp enhancer (F2-6) is highlighted (yellow box). Asterisks denote conserved nucleotides across all three species. (B) Recombinant ETS1 DNA-binding domain (DBD) was used in EMSA with radiolabelled probe encompassing a confirmed ETS-binding site from the Mef2c F7 enhancer. Lane 1 contains reticulocyte lysate lacking ETS1 DBD. ETS1 DBD bound the bona fide ETS-binding site in the control probe (Mef2c F7) (lane 2) and this specific binding was competed away by unlabeled control probe (lane 3), but binding was not competed by a control probe with a mutated ETS site (lane 4). Unlabeled probes corresponding to each of the potential ETS sites in the Dll4 F2 enhancer were used as competitors for ETS1 DBD binding to the control probe (lanes 5-18). The Dll4 F2 sites competed for ETS DBD binding to varying degrees. Probes encompassing ETSB, ETS-D, ETS-H, ETS-I, ETS-J, and ETS-L competed most efficiently (lanes 8, 10, 13, 14, 15, 17, respectively). In addition to the GGA(A/T) core, ETS-B and ETS-H possessed (or overlapped with) canonical ETS sites (cETS). cETS-1/ETS-B was a consistent competitor (lanes 5 and 8), and directly bound the ETS1-DBD (panel C), but cETS-2 (lane 6) and ETS-H (lane 13) did not compete consistently, and they did not bind the ETS1-DBD directly (data not shown). (C) EMSA showing binding of ETS1 DNA binding domain (DBD) to the ETS-B site of F2-6. Binding was competed by an excess of unlabeled wild-type but not ETS-B mutant probe. (D) EMSA was performed using F2 probe and recombinant ETV2 protein. Wild-type F2 sequence effectively competed for ETV2 binding, but this competition was lost when the ETS-B site was mutated. |
|
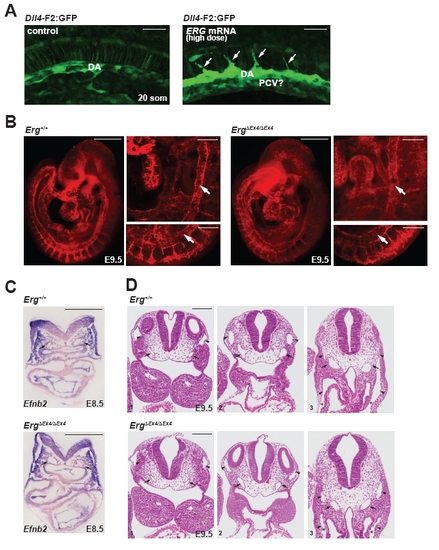
Figure S4 (Related to Figure 4): Analysis of ERG gain- and loss-of-function phenotypes. (A) Injection of high doses of ERG mRNA (400 pg) in zebrafish embryos resulted in enhanced F2:GFP expression at the 20-somite stage. Premature sprouting of intersomitic vessels (arrows) was also observed. Cells were present ventral to the dorsal aorta that express F2:GFP. These may be ventrally sprouting posterior cardinal vein cells. Scale bar = 50 μm. (B) Wild-type (n=2) and ErgΔEx4/ ΔEx4 (n=2) embryos (E9.5) were stained with PECAM antibodies and confocal microscopy was utilized to observe vascular patterning. The dorsal aorta (arrow) was present and morphologically normal in Erg knock-out embryos. Scale bars = 500 μm (wholemount) and 110 μm (zoom ins). (C) Section in situ hybridization at E8.5 reveals reduced Efnb2 mRNA in the dorsal aorta (arrows) in Erg knock out embryos (n=2) compared to wild-type littermates (n=2). Sections are counter-stained with nuclear fast red. Scale bar = 100 μm. (D) Histology of serial cross-sections through wild-type (n=3) and Erg knock-out embryos (E9.5) (n=2) did not reveal gross morphological defects in arteries or veins. Dorsal aorta (arrow); cardinal vein (caret). Scale bar = 100 μm. |
|
Figure S6 (Related to Figure 6 and Figure 7): The F2 enhancer and endogenous Dll4 expression are regulated by Vegf/MAP kinase signaling. (A) From the experiment shown in Figure 6C,D, induction of Vegfa-inducible efnb2 was also inhibited in embryos injected with erg/fli1a morpholinos. Shown is qRT-PCR from 5 individual embryos per group (mean ± SEM). * indicates a significant difference by 1-way ANOVA. ns, not significant. (B) F2-luciferase activity was enhanced upon inhibition of PI3 kinase signaling (LY29004 treatment) in BAEC. The activity of F2-luciferase was decreased, and the responsiveness to PI3K inhibition was lost, when the ETS-B site was mutated. Shown is a representative experiment, triplicate determinations (mean ± SEM). (C) F2:GFP or kdrl:GFP embyros were treated the MAP kinase inhibitor, U0126, starting at the 10-somite stage, and imaging was performed at 26 or 28 hpf. F2:GFP expression was decreased in the presence of U0126, but kdrl:GFP was unaffected. (D) Quantification of (C) is shown (n=4 per group; mean ± SEM). (E) Expression of endogenous dll4, efnb2a, hey2 and kdr was assessed by qRT-PCR (n=5-10 individual embryos; mean ± SEM). (F) Embryos were injected with a construct that drives expression of constitutively active MEKK in the endothelium (Fli1-mCherry-ActMEKK). In embryos with expression of the construct in the vein, F2:GFP expression was also observed in venous cells (arrows). |
Reprinted from Developmental Cell, 26(1), Wythe, J.D., Dang, L.T., Devine, W.P., Boudreau, E., Artap, S.T., He, D., Schachterle, W., Stainier, D.Y., Oettgen, P., Black, B.L., Bruneau, B.G., and Fish, J.E., ETS Factors Regulate Vegf-Dependent Arterial Specification, 45-58, Copyright (2013) with permission from Elsevier. Full text @ Dev. Cell


