- Title
-
An exclusively mesodermal origin of fin mesenchyme demonstrates that zebrafish trunk neural crest does not generate ectomesenchyme
- Authors
- Lee, R.T., Knapik, E.W., Thiery, J.P., and Carney, T.J.
- Source
- Full text @ Development
|
Paraxial mesoderm expression often precedes fin mesenchyme expression. (A-F) Confocal images of the trunk and tail regions of the ET37 (A-C) and ET5 (D-F) zebrafish lines immunofluorescently stained for eGFP. Lateral views at 48 hpf (A,D) and 24 hpf (B,E) show that expression in fin mesenchyme follows earlier expression in the mesoderm. Transverse confocal images of the trunk of ET37 (C) and ET5 (F) at 20 hpf show expression in paraxial mesoderm as well as at other sites. (G-O) Micrographs of embryos stained by in situ hybridisation with probes against bmp1a (G-I), hmcn2 (J-L) and fbln1 (M-O). Lateral views show the fin mesenchyme expression at 48 hpf (G,J,M) and the preceding mesodermal expression at 24 hpf (H,K,N). Mesodermal expression is paraxial as shown in images of transverse sections of 20-hpf embryos viewed with Nomarski optics (I,L,O). EXPRESSION / LABELING:
|
|
Fin mesenchyme cells emerge from trunk mesoderm. Stills of time-lapse Movies 1-3 (see supplementary material Movies 1-3) of the tail of the ET37 line alone (A,B) or crossed to the ntla:lyn-tdtomato transgenic line (C). eGFP is shown in green and membrane-tdTomato is in magenta. Left panels are taken at <26 hpf (A), 29 hpf (B) and 22 hpf (C), with subsequent time points (indicated in minutes) shown in panels to the right. Examples of fin mesenchyme cells are indicated (arrows) emerging from the ventral (A,C) and dorsal (B) mesoderm into the adjacent fin. First panel of C is shown without eGFP signal to highlight the epithelial nature of the cells within the mesoderm prior to fin immigration. EXPRESSION / LABELING:
|
|
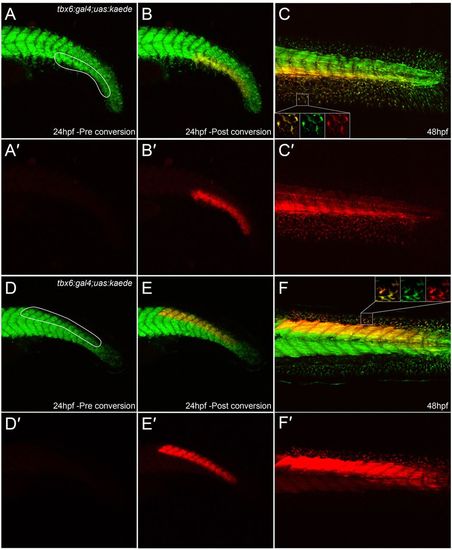
Extensive contribution of mesoderm to fin mesenchyme. (A-F2) Tail of tbx6:gal4; uas:kaede embryos at 24 hpf (A-B2,D-E2) and 48 hpf (C,C2,F,F2) both prior to (A,A2,D,D2) and after (B-C2,E-F2) Kaede photoconversion. Unconverted Kaede protein is in green, overlaid with UV-photoconverted Kaede in red (A-F); the red channel is additionally displayed alone for clarity (A2-F2). Ventral (A-C2) and dorsal (D-F2) regions converted by UV laser are outlined in A and D. At 48 hpf, converted cells can be seen in the adjacent fins (magnified in insets in each channel and merged, C,F) and muscle blocks (C,C2,F,F2). |
|
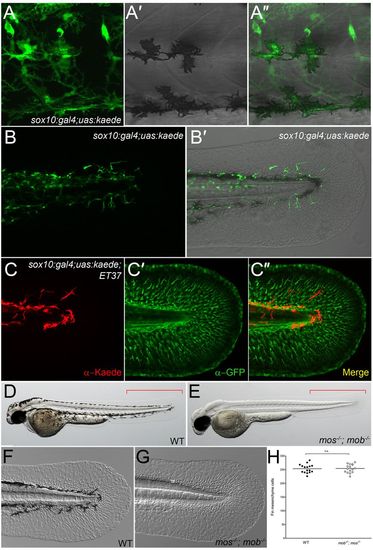
Neural crest cells do not contribute to fin mesenchyme. (A-B2) Lateral trunk (A-A2) and tail region (B,B2) of 48-hpf sox10:gal4; uas:kaede transgenic embryos. Kaede protein fluorescence (green) is observed in melanophores (A-A2), nascent dorsal root ganglia and spinal nerves (A), as well as in the fin (B,B2). (C-C2) Immunofluorescent labelling of Kaede (red, C), eGFP (green, C2) and merged image (C2) of the fin of a sox10:gal4; uas:kaede; ET37 transgenic embryo. (D-G) Overviews (D,E) and Nomarski images (F,G) of 48-hpf wild-type (WT) (D,F) and mos-/-; mob-/- (E,G) embryos showing loss of pigment but presence of a fully formed medial fin (E) with fin mesenchyme cells (G) in the double mutant. Red brackets indicate the region used for quantifying fin mesenchyme cells in H. (H) Quantification of fin mesenchyme cells in 12 WT and 12 mos-/-; mob-/- embryos at 48 hpf. No significant differences (n.s.) were observed (two-tailed Student’s t-test). Bars indicate the mean. EXPRESSION / LABELING:
|
|
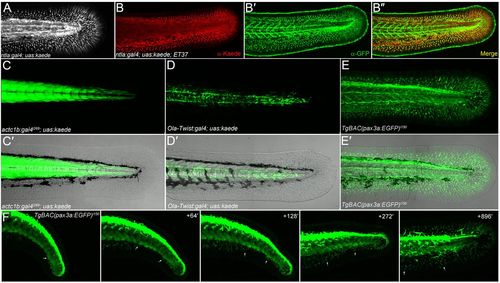
All fin mesenchyme cells derive from paraxial mesoderm. (A) Confocal image of the tail region of a 48-hpf ntla:gal4; uas:kaede embryo. (B-B2) Immunofluorescent staining of 48-hpf ntla:gal4; uas:kaede; ET37 triple transgenic embryo showing total overlap (B2) of Kaede signal (red, B,B2) and eGFP (green, B2,B2) in the fin. (C-E2) Fluorescent images alone (C,D,E) and superimposed on Nomarski images (C2,D2,E2) of the trunk/tail of 48-hpf embryos. The myotome (C,C2), sclerotome (D,D2) and dermomyotome (E,E2) are labelled by actc1b:Gal4i269; uas:kaede (C,C2), Ola-Twist:Gal4; uas:kaede (D,D2) and TgBAC(pax3a:EGFP)i150 (E,E2) transgenics, respectively. (F) Stills taken from time-lapse Movie 4 (see supplementary material Movie 4) of the tail region of a TgBAC(pax3a:EGFP)i150 embryo at 24 hpf (left panel) with subsequent time points at given intervals (in minutes) in the panels to the right. Two fin mesenchyme cells can be tracked (arrows) from the dermomyotome into the fins. Note that eGFP expression is higher in neural crest and dorsal neural tube than in dermomyotome. |
|
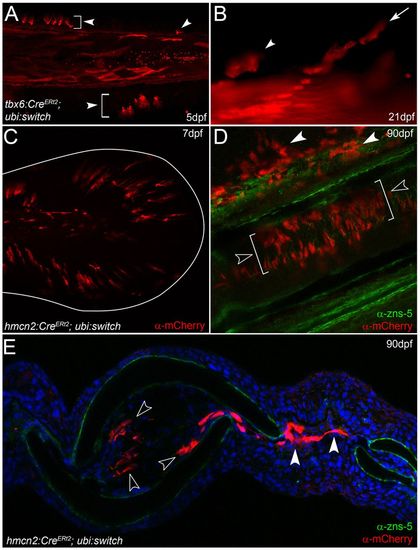
Fin mesenchyme contributes to the adult fin fibroblasts. (A,B) tbx6:CreERt2; ubi:switch transgenics treated with 4-hydroxytamoxifen and imaged at 5 dpf (A) and 21 dpf (B). Arrowheads indicate fin mesenchyme cells in the larval fin (A) and retained in juvenile fin (B). Chains of cells are seen invading at 21 dpf (arrow in B). (C-E) Images of ubi:switch transgenics injected with hmcn2:CreERt2 BAC transgene and treated with 4-hydroxytamoxifen from 3-4 dpf. (C) Tail region of 7-dpf larva shows mCherry in fin mesenchyme cells. The extent of the fin is outlined. (D,E) Adult fins immunostained for mCherry (red) and with zns-5 antibody (green) imaged in lateral whole-mount (D) or in transverse view following cryosectioning and counterstaining with DAPI (E). mCherry cells are in locations consistent with fibroblasts and are zns-5 negative. They reside within the fin rays (open arrowheads in D,E) or can be seen in the inter-ray region (white arrowheads in D,E). EXPRESSION / LABELING:
|
|
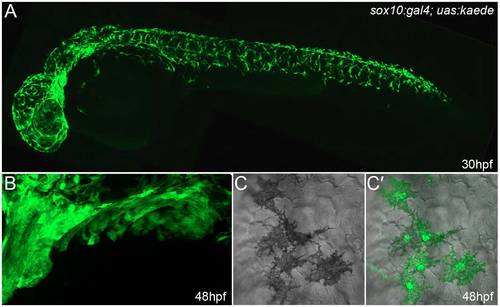
Neural crest cells are well labelled in sox10:gal4; uas:kaede embryos. Lateral confocal images of 30-hpf (A,C,C′) and 48-hpf (B) sox10:gal4; uas:kaede transgenic embryos immunostained with an antibody detecting Kaede. (A) Broad and robust neural crest labelling along the entire axis can be seen at 30 hpf. (B) Lateral view of the branchial arches at 48 hpf showing extensive labelling of presumptive ectomesenchymal neural crest. (C,C′) Images showing DIC alone (C) or overlaid on a fluorescent image of Kaede expression demonstrates labelling of melanophores in sox10:gal4; uas:kaede transgenic embryos (C′). In this image, it can be seen that all five melanocytes express Kaede. Quantification of five 30-hpf sox10:gal4; uas:kaede transgenic embryos showed that at least 93.0% of melanophores are labelled by Kaede (a total of 545 melanophores was counted). |
|
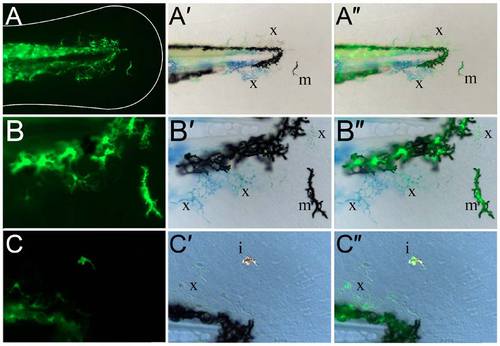
Kaede-positive cells in the fin are chromatophores. (A-C") Lateral views of the fin region of three 3-dpf sox10:gal4; uas:kaede transgenic embryos displaying Kaede green fluorescence (A,B,C) and brightfield views (A′,B′,C′). An overlay of the fluorescence image on the brightfield image is also shown (A",B",C"). At both low (A-A") and high (B-C") magnification, it can be observed that the Kaede-positive cells in the fin (A,B,C) correspond to black melanophores (m; A′,A",B′,B"), xanthophores with characteristic yellow/blue colouration (x; A′,A",B′,B",C′,C") or reflective iridophores (i; C′,C"). |
|
Permanent lineage analysis confirms the origin of embryonic fin mesenchyme. (A,A′) Lateral confocal images of 72-hpf sox10:Cre; ubi:switch embryos fluorescently immunostained with an antibody detecting mCherry. Image of mCherry expression within the posterior trunk and fin (A) and also superimposed on a Nomarski view to show limited cells within the fin (A′). These embryos have neural crest lineages permanently labelled with mCherry, and show labelled cells within the trunk in locations and with morphology consistent with described neural crest derivatives. Fin mesenchyme is unlabelled. (B,B′) Lateral confocal images of 3-dpf tbx6:Cre; ubi:switch embryos fluorescently immunostained with an antibody detecting mCherry. (B) mCherry expression within the posterior trunk and fin with widespread expression visible in the fin mesenchyme and muscle of trunk. (B′) Fluorescent image superimposed on a Nomarski view outlining expression domains within the fin. |
|
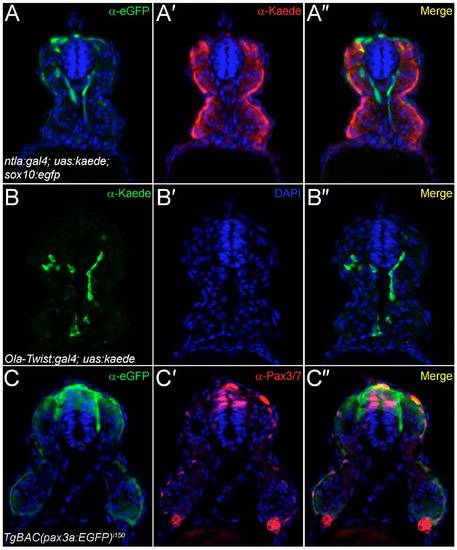
Analysis of transgenic lines used to define the origin of fin mesenchyme. Transverse cryosections of the trunk region of the ntla:gal4; uas:kaede (A-A"), the Ola-Twist:gal4; uas:kaede (B-B") and the TgBAC(pax3a:EGFP)i150 (C-C") transgenic lines at 24 hpf, imaged by confocal microscopy following fluorescent immunostaining with antibodies against eGFP (A-A",C-C"), Kaede (A-A",B-B") and Pax3/7 (C-C0). All sections were counterstained with DAPI (blue). (A-A") To demonstrate exclusion of Kaede expression from neural crest, the ntla:gal4; uas:kaede line was crossed to the sox10:egfpba2 line and immunostained for eGFP (A) and Kaede (A′). Restriction of Kaede to the mesoderm and exclusion from the neural crest can be seen in the superimposed image (A"). (B-B") Expression of Kaede in the Ola-Twist:gal4; uas:kaede line is largely restricted to the sclerotomal compartment of the somites as seen by immunostaining for Kaede expression (B), which can be seen in a medial somitic location (B") and far removed from the superficial dermomyotome domain. Occasional myotome expression can be observed in this line (B"). (C-C") The TgBAC(pax3a:EGFP)i150 line faithfully recapitulates Pax3 expression in the dermomyotome as shown by comparing eGFP immunofluorescence (C) with Pax3/7 immunoreactivity (C′). By superimposition of the two confocal images, eGFP-positive dermomyotome cells at the somite surface have Pax3/7-positive nuclei, with strong eGFP and Pax3/7 colabelling in the dorsal neural tube and neural crest also apparent (C"). |
|
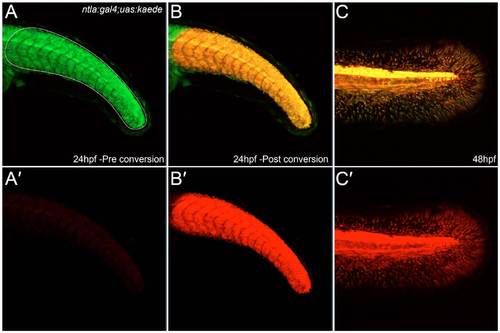
Photoconversion of Kaede demonstrates that fin mesenchyme derives from earlier ntla mesoderm expression domains. (A-C′) The tail region of an ntla:gal4; uas:kaede transgenic embryo imaged at 24 hpf (A-B′) and again at 48 hpf (C,C′) both prior to (A,A′) and after (B-C′) Kaede photoconversion. Unconverted Kaede protein is shown in the green channel, which is overlaid with UV-photoconverted Kaede in the red channel (A,B,C). The red channel is additionally displayed alone for clarity (A′,B′,C′). The Kaede protein present at 48 hpf in the fin mesenchyme is photoconverted, demonstrating that it corresponds to perdurance of Kaede from the mesodermal expression domain at 24 hpf. |


