- Title
-
Cell proliferation patterns in early zebrafish development
- Authors
- Mendieta-Serrano, M.A., Schnabel, D., Lomelí, H., and Salas-Vidal, E.
- Source
- Full text @ Anat. Rec. (Hoboken)
|
Nuclei distribution patterns during early zebrafish development. DNA and nuclei were visualized in whole SYTOX Green stained embryos by laser confocal microscopy. The images in this figure are complementary to images shown in Fig. 1. Scale bar 500 µm. |
|
Proliferation patterns in 512- (A–C) and 1k-cell stage zebrafish embryos (D–L). The punctuated line shows the contour of the embryos, and continuous lines indicate the margin between blastoderm and the yolk cell. I: A 1k-cell embryo showing the characteristic yolk syncytial layer (YSL) nuclei (yellow arrowhead in D), with all their nuclei positive for the PH3 marker (arrowheads in E). Asterisks in E indicate clusters of nuclei negative for the PH3 marker. Arrowhead in F insert shows a metaphase cell II: A 1k-cell embryo showing the blastoderm and YSL nuclei (yellow arrowhead in G) negative for the PH3 marker (H). Arrowhead in I insert shows an interphase cell. III: A 1k-cell embryo showing only one YSL nuclei (yellow arrowhead in J) positive for the PH3 marker (K) and scattered blastoderm cells in mitosis. Arrowhead in I insert shows an interphase cell. Arrowheads in L insert shows cell nuclei at different stages of mitosis and the arrow shows an interphase nuclei. Lateral views are shown. Nuclei are in green, PH3 marker in red. Scale bar 200 µm in C; 50 µm in L. |
|
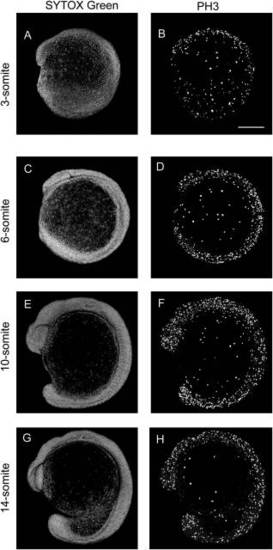
Proliferation patterns from 3- to 14-somite stage embryos. (A, B) 3-somite stage embryo. (C, D) 6-somite stage embryo. (E, F) 10-somite stage embryo. (G, H) 14-somite stage embryo. Lateral views. 200 µm scale bar in B. |
|
Proliferation patterns in 18-somite stage embryos. I: Left side views of 18-somite embryos. II: Dorsal views of 18-somite embryos. (A, B) Full confocal slice projections. Asterisk indicates the yolk extension. (C, D) Partial confocal slice projections where most superficial slices were omitted to highlight internal patterns. White doted lines highlight different structures like the eye (e), neural tube (nt), and otic vesicle (ov). In D, the arrowhead indicates the border between mesencephalon and rhombencephalon and the arrows mark rhombomeres limits. (E, H) Dorsal view of 18-somite stage embryo. The embryo shows abundant PH3 positive nuclei in the main axis as compared to the yolk cell (H). (G, H) Amplification of corresponding inserts shown in E and F to highlight the dorsal region of the neural tube (white arrowheads), that shows mitotic nuclei arranged in two rows along the antero–posterior length of the embryo. 200 µm scale bar in B. 100 µm scale bar in H. |
|
Proliferation patterns in 27-somite stage embryos. I: Left-side views. II: Partial projections were most superficial slices were omitted to highlight internal patterns. III: Dorsal views. The embryo shows abundant PH3 positive nuclei in the main axis as compared to the yolk cell. The dorsal region of the neural tube (white arrowheads) shows mitotic nuclei arranged in two rows along antero–posterior length of the embryo as in the previous stage analyzed. (g, h inserts): show an amplification to highlight the structure and proliferation patterns in the neural tube. e, eye; mb, midbrain; c, cerebellum; hb, hindbrain; ov, otic vesicle. 200 µm scale bar in B. 50 µm scale bar in h insert. |
|
Proliferation patterns in 28-somite stage embryos. I: Full confocal slice projections of an entire embryo. II: Partial confocal slice projections of the brain region. White doted lines highlight structure like the eye (ey), midbrain (mb), cerebellum (c), hindbrain (hb), and otic vesicle (ov). White arrowheads in D indicate mitotic nuclei in midbrain and hindbrain. White arrows indicate regions with less abundant mitotic nuclei in brain regions. III: Partial projections of the tail region show structures corresponding to the notochord (nc) and myotomes (my). (e and f) Inserts show sagital sections of images indicated in images E, F by the white dotted lines. Notice the positive nuclei for PH3, except in the corresponding notochord and yolk extension. ey, eye; mb, midbrain; hb, hindbrain; c, cerebellum; nt, neural tube; ye, yolk extension. 200 µm scale bar in B. 100 µm scale bar in f insert. |


