
- Title
-
Characterization of transgenic zebrafish lines that express GFP in the retina, pineal gland, olfactory bulb, hatching gland, and optic tectum
- Authors
- Fang, W., Bonaffini, S., Zou, J., Wang, X., Zhang, C., Tsujimura, T., Kawamura, S., and Wei, X.
- Source
- Full text @ Gene Expr. Patterns

Crb2b expression in photoreceptors is not suppressed in transgenic fish Tg(LCRRH2-RH2-2:GFP)pt115. (A) A schematic illustrates the structures and tandem arrangement of a crb2b-targeting shRNA gene and a GFP reporter gene in the transgenic constructs for generating the Tg(RH2-2:GFP)pt115 fish lines. The region amplified in the PCR genotyping assay (see panel C) is indicated with a double-headed arrow. (B) The sequences of the sense and anti-sense regions of the crb2b-targeting shRNA genes are presented and the mismatching nucleotides are underlined. (C and D) PCR analyses suggest that the shRNA transgenes are present in all stable pt115 lines (arrow) at 5 dpf (C) and 9 mpf (D). However, RT-PCR analyses did not suggest apparent shRNA transgene transcripts at the size of genomic DNA PCR product. Genomic DNA PCR and RT-PCR of β-actin gene were conducted as controls for the quality of PCR DNA template, especially for genomic DNA contamination of cDNA. (E) The expression levels of Crb2b (red) in the transgenically expressing (arrowheads) and transgenically non-expressing retinal regions (arrows) were similar in adult shRNA-1 founder fish, suggesting no suppression of Crb2b by the shRNA transgenes. Transgenic cells were visualized by GFP reporter signals. Green cones are labeled with the letter G, and blue cones are labeled with letter B. The identification of cone types was based on the stereotypical spatial alignment of zebrafish cones in the order of UV–green–red–blue–red–green within the two dimensional photoreceptor mosaics ( Robinson et al., 1993, Raymond et al., 1995 and Zou et al., 2012) and green/red double cone (DC) staining with the zpr1 antibody. This identification method was also applied to Fig. 3, Fig. 4, Fig. 5 and Fig. 6. (F) In homozygous adult transgenic Tg(LCRRH2-RH2-2:GFP)pt11-k5 fish, the expression of Crb2b did not show apparent reduction because the expression levels at cone inner segment junctions next to transgenically-expressing cells (arrows) and non-transgenically-expressing cells (arrowheads) were identical. |
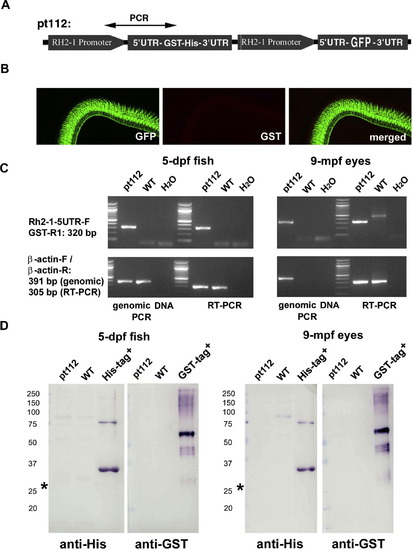
Transgenic zebrafish line Tg(LCRRH2-RH2-1:GFP)pt112, expresses GFP but not GST-His fusion in the retina. (A) The schematic illustrates the structures and tandem arrangement of the GST-His and GFP reporter genes in the transgene construct that was used to generate the Tg(LCRRH2-RH2-1:GFP)pt112 line. The regions amplified by PCR genotyping reactions are indicated with double-headed arrows. (B) In the adult Tg(LCRRH2-RH2-1:GFP)pt112 retina at 8 mpf (months postfertilization), the expression of the GST-His protein was undetectable, whereas GFP expression is very strong. (C) RT-PCR and genomic DNA PCR analyses demonstrated that the GST-His gene was present in the Tg(LCRRH2-RH2-1:GFP)pt112 genome, and was apparently transcribed at both 5 dpf and 9 mpf. (D) Western blotting analyses confirmed that GST-His fusion protein was not expressed in Tg(LCRRH2-RH2-1:GFP)pt112 fish at both 5 dpf and 9 mpf. The asterisks indicate the position where the fusion protein was supposed to be. Unrelated His-Tagged and GST-tagged recombinant proteins expressed in Escherichia coli were used as controls for Western blotting conditions. |
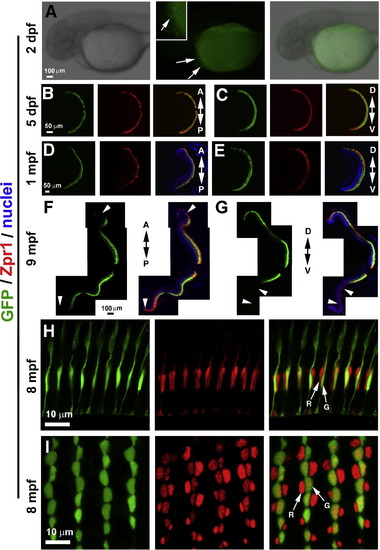
The Tg(LCRRH2-RH2-2:GFP)pt115-k line expresses GFP in the green cones and hatching gland. (A) Stereo-fluorescent microscopy shows weak GFP signals in the hatching gland at 2 dpf (arrows). The inset shows a magnified image of the GFP-positive hatching gland cells. The green fluorescent signals in the yolk were non-specific auto-fluorescence. (B–E) GFP expression is present in the entire photoreceptor layer in the retina at 5 dpf and 1 mpf. A-P and D-V arrows are for anterior-posterior and dorsal–ventral direction, respectively. (F and G) At 9 mpf, the GFP expression is absent in anterior and posterior peripheral retinal regions as well as a significantly large ventral retinal area. (H and I) Vertical (H) and transverse (I) imaging of photoreceptors show GFP (green) is specifically expressed in green cones (arrow G), but not in red cones (arrow R) or other types of photoreceptors (8 mpf). The green/red double cones were visualized with zpr1 antibodies. The cell nuclei were labeled with DAPI. |

The Tg(LCRRH2-RH2-2:GFP)pt115-c line expresses GFP in the green cones, hatching gland, and optic tectum. (A and B) Bright field (A) and stereo-fluorescence (B) imaging shows GFP signals in the retina at 4 dpf. The top fish is a wildtype larval control, and the bottom is a Tg(LCRRH2-RH2-2:GFP)pt115-c transgenic larva. (C) There are about one dozen GFP positive cells on each side of the brain in the optic tectum region at 4 dpf (arrows). (D) A confocal image illustrates the extensive cell processes of the GFP-positive cells in the optic tectum, suggesting that they are neurons (arrowheads for the cell bodies). (E and F) Confocal imaging of the cross sections of the 4-dpf brain revealed that the GFP positive cells in the optic tectum are in the superficial regions. Insets show a magnified superficial region of the optic tectum (OT) and the arrowheads indicate the cell bodies of GFP positive cells. The nuclei were labeled with TO-PRO. Actin was labeled with phalloidin in blue. (G–J) GFP expression is present in the photoreceptor layer of the entire retina at 5 dpf and 1 mpf. A-P and D-V arrows indicate anterior-posterior and dorsal–ventral directions, respectively. (K and L) At 9 mpf, the entire retina maintains strong GFP expression, except for a small ventral retinal region (arrowhead, L). (M and N) Only green cones in 8-mpf adult retina express GFP. The double cones (red) were visualized by the zpr1 antibodies. M shows a vertical section and N shows a transverse section. |

The Tg(LCRRH2-RH2-2:GFP)pt115-j line expresses GFP in several types of photoreceptors, the hatching gland, pineal gland, and olfactory bulb. (A) Bright field and fluorescence images show GFP signals (green) in the hatching grand, pineal gland, and a small region in the forebrain (arrowhead) at 3 dpf. (B) Imaging on the frontal plane revealed that the GFP-positive cells in the forebrain at 48 hpf (panel A, arrowhead) correspond to a small region in the olfactory bulb (arrows), immediately next to the olfactory epithelia (OE). The anterior is on top. (C) A more ventral-positioned imaging on the frontal plane at 48 hpf (compared to panel B) revealed extensive GFP expression in the mesenchyme-derived tissues in the head and trunk (arrows). (D and E) Vertical (D) and transverse (E) confocal imaging of photoreceptors in 8-mpf adult retina revealed GFP signals in the green, red, and blue cones as well as some rods (arrowheads). However, certain rods do not express GFP (asterisks). Double cones were labeled with zpr1 antibody in red; arrow G, green cones; arrow B, blue cones; arrow R, red cones. (F and G) GFP is expressed in the photoreceptor layer in the entire retina at 1 mpf. (H and I) At 9 mpf, strong GFP expression is maintained in the photoreceptor layer in the entire retina. A-P and D-V arrows indicate anterior–posterior and dorsal–ventral directions, respectively. |

The Tg(LCRRH2-RH2-1:GFP)pt112 line expresses GFP strongly in green and blue cones and weakly in red cones in the retina. (A and B) At a low non-saturating laser excitation condition, similarly strong GFP expression levels were detected in the green and blue cones in 3-mpf retina. The panels in B are magnified local regions from the panels in A. (C) Transverse imaging of the photoreceptor layer shows the mosaic organization of the GFP-expressing green and blue cones at 3 mpf. (D) At a strong saturating laser excitation condition, weak GFP expression was detected in some but not all red cones (arrowheads) in the 3-mpf retina. (E) At 7 mpf, weak GFP expression was detectable in most red cones even under non-saturating laser excitation conditions. (F and I) GFP expression is present in the photoreceptor layer in the entire retina at 1 mpf and 9 mpf. The nuclei were labeled with TO-PRO nuclear dye or DAPI (blue, A–C). UV, green, red, and blue cones are indicated with lettered-arrows U, G, R, and B, respectively. |
Reprinted from Gene expression patterns : GEP, 13(5-6), Fang, W., Bonaffini, S., Zou, J., Wang, X., Zhang, C., Tsujimura, T., Kawamura, S., and Wei, X., Characterization of transgenic zebrafish lines that express GFP in the retina, pineal gland, olfactory bulb, hatching gland, and optic tectum, 150-9, Copyright (2013) with permission from Elsevier. Full text @ Gene Expr. Patterns