
- Title
-
Formation of the Embryonic Organizer Is Restricted by the Competitive Influences of Fgf Signaling and the SoxB1 Transcription Factors
- Authors
- Kuo, C.L., Lam, C.M., Hewitt, J.E., and Scotting, P.J.
- Source
- Full text @ PLoS One
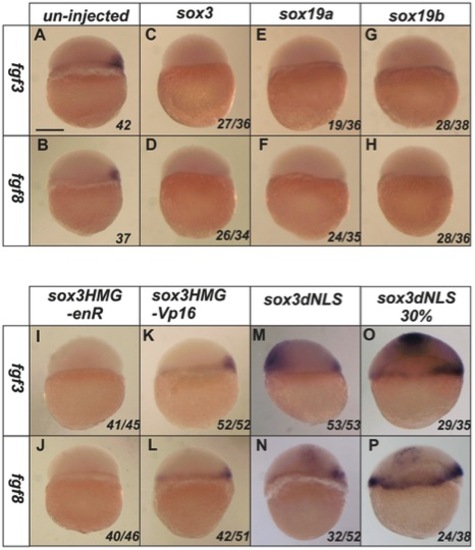
SoxB1 factors acts as transcriptional repressors to inhibit the expression of fgf3 and fgf8. At 4.5 hpf, the expression of fgf3 and fgf8 is restricted in the dorsal shield region of un-injected embryos (A–B). Injection of sox3, sox19a or sox19b RNA at the 1–2 cell stage caused complete loss of expression of both fgf3 and fgf8 at 4.5 hpf (C–H). A Sox3HMG-EnR (I,J) but not a Sox3HMG-VP16 (K,L) fusion mimicked the function of wild-type Sox3 to inhibit fgf3 and fgf8 expression. Ectopic expression of fgf3 and fgf8 was induced by the dnSox3 construct injected at the 1–2 cell stage and analysed at 4.5 hpf (M,N) or later at 30% epiboly (5.5 hpf) (O,P). All images are lateral views with dorsal to the right (where this can be determined). The proportion of embryos exhibiting these phenotypes is shown at the bottom right of each panel. Scale bar in panel A represents approximately 100 μm. |
Sox3 can directly bind to a region upstream of fgf3. (A) Synteny in the region of the genome flanking the fgf3 gene. Coloured boxes indicate different genes and direction of transcription. Not to scale. Absence of line indicates incomplete genomic scaffold information. (B) Diagram showing the upstream region of fgf3. Green bars indicate regions of homology among different species. The position of potential Sox binding sites (A/T)(A/T)CAA(A/T)G within these homologous regions are shown as black bars and similar potential Sox binding sites lacking the final 3′ “G” are shown as gray bars. The red bars show the PCR products, including the Sox binding sites that would be produced by different primer pairs. (C) 25 pg sox3-HA and sox3N40I-HA RNA were injected at the 1–2 cell stage embryos and harvested at 4.5 hpf. ChIP analysis using an anti-HA antibody to precipitate Sox3 and bound DNA. PCR results after ChIP procedure showed that the DNA fragments pulled down by Sox3-HA can be amplified only by primer pair 2. tubb5 was included as a negative control. (D) Quantitative PCR results of precipitated chromatin using primer pairs 2 and 3 showed that the target sequence for primer pair 2 was significantly enriched following IP of WT Sox3 whereas the target for primer pair 3 was not. Values represented as fold change compared to the uninjected value. |
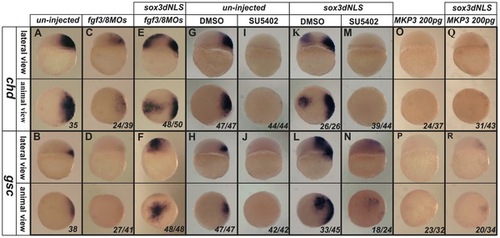
Induction of ectopic chd and gsc expression by dnSox3 requires Fgf signalling. Endogenous expression of chd and gsc (A,B) was inhibited by injection at 1–2 cell stage of a combination of morpholinos targeting both fgf3 and fgf8 (C,D), but these had little effect upon the ectopic expression of chd and gsc induced by injection of a dnSox3 construct (E,F). Treatment of embryos with the FGF signalling inhibitors, SU5402 (I,J) or MKP3 (O,P) (but not an equivalent concentration of the solvent DMSO alone) (G,H), at the 1–2 cell stage totally inhibited both endogenous expression of chd and gsc and ectopic expression induced by injection of a dnSox3 construct (K–N,Q,R). Lateral view and dorsal is to the right in upper panels, viewed from animal pole in lower panels. The proportion of embryos exhibiting these phenotypes is shown at the bottom right of each panel. |
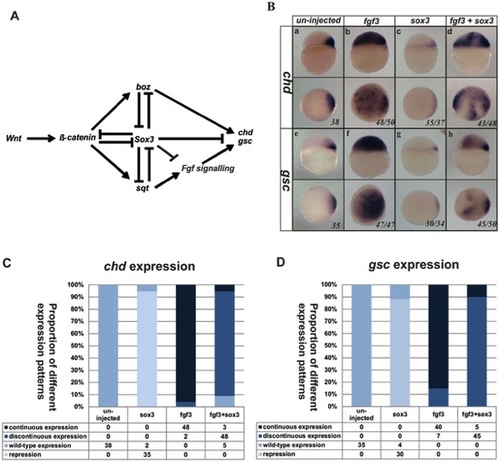
Sox3 represses expression of chd and gsc independently of repressing fgf expression. (A) Model of the signalling network that controls organizer formation. Sox3 plays a central role in this model to repress Fgf signalling in addition to independently repressing other genes needed for organizer formation. Injection of fgf3 RNA at the 1–2 cell stage dramatically expanded both chd and gsc expression in the animal hemisphere (Ba,b,e,f). Injection of wild-type sox3 RNA not only inhibited the endogenous expression of chd and gsc (Bc,g), but was also able to partially inhibit the expansion of chd and gsc expression that was induced by injection of fgf3 (Bd,h). (C,D) Graphical representation of the numbers of embryos affected in these experiments. Lateral view and dorsal is to the right in upper panels, viewed from animal pole in lower panels. The proportion of embryos exhibiting these phenotypes is shown at the bottom right of each panel. |
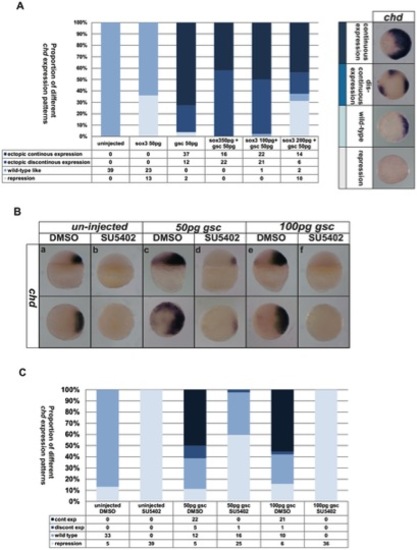
Effects of FGF and Sox3 upon the expression of chd cannot be rescued by Gsc. Injection of different mixtures of sox3 or gsc RNA resulted in a range of expression levels of chd from complete repression to dramatic ‘continuous’ expansion as shown in the right of panel A. The phenotypes seen when combinations of sox3 and gsc were injected, were intermediate between those when sox3 or gsc alone were injected (Shown in bar chart in panel A). Treatment with SU5402 was able to inhibit chd expression (Ba,b) even when 50 pg (Bc,d) or 100 pg (Be,f) gsc RNA was also injected. Shown in bar chart in panel C. The proportion of embryos exhibiting these phenotypes is shown at the bottom right of each panel. |

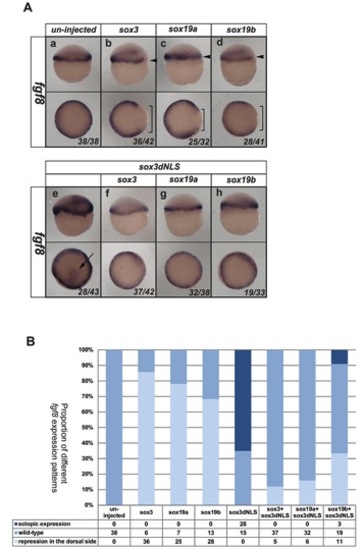
Inhibition of Fgf signaling causes expansion of sox3 and sox19a expression into the vegetal margin. In situ hybridization for sox3 (A–D), sox19a (E–H) or ntl (I–L). Expression of sox3 and sox19a (dark purple) is seen throughout the entire animal hemisphere at the 30% epiboly stage, when only a very thin band of ntl expression was seen around the vegental margin (I). Although expression of ntl was completely lost following treatment with SU5402 (but not in the DMSO control) (I,J), it was not possible to detect any change in expression of sox3 or sox19a (A,B,E,F). However, treatment with SU5402 also resulted in loss of expression of ntl by the 60% epiboly stage (K,L) (position of vegetal margin identified with red bars), which was concomitant with expansion of the expression of sox3 and sox19a towards the vegetal margin (D,H) (region of expansion of expression shown with red brackets in panels C,D,G,H). Close analysis of the dorsal organizer region revealed that, as in untreated embryos (M), sox3 expression is absent from the region of the organizer. Treatment with SU5402 (or DMSO as a control) did not alter the exclusion of sox3 expression from this region (N,O). The expression of boz (dark purple) also remained unaltered with a gap in between the domains of sox3 and boz expression maintained (P,Q; arrow). All treatments were started at 3 hpf (the time that zygotic expression begins). All panels are lateral views, dorsal to the right except lower panels of M–Q, which are animal pole views. The proportion of embryos exhibiting these phenotypes is shown at the bottom right of each panel. |

Endogenous expression of (A) fgf3 and (B) fgf8 first could first be detected in the organizer region at 4.5 hpf during early zebrafish development. Lateral view and dorsal is to the right in upper panels, viewed from animal pole in lower panels. |
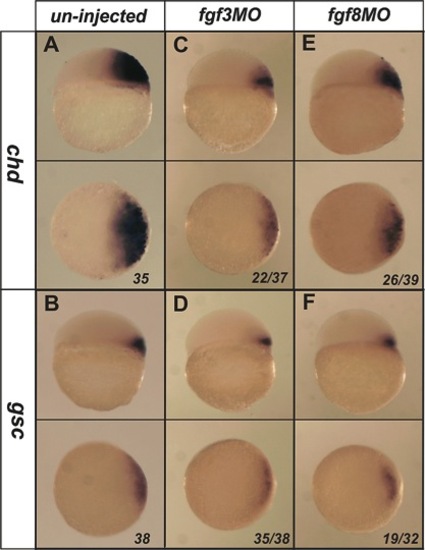
Single morpholinos targeting fgf3 or fgf8 have limited inhibitory effects on the expression of chd and gsc. Injection of an fgf3MO (5 ng) at the 1–2 cell stage caused a substantial, but incomplete, reduction in the domain of expression of chd and gsc at 4.5 hpf (A–D). Injection of an fgf8MO (5 ng) at the 1–2 cell stage caused a significant, but lesser, inhibition of chd and gsc expression (E,F). Lateral view and dorsal is to the right in upper panels, viewed from animal pole in lower panels. The proportion of embryos exhibiting these phenotypes is shown at the bottom right of each panel. |
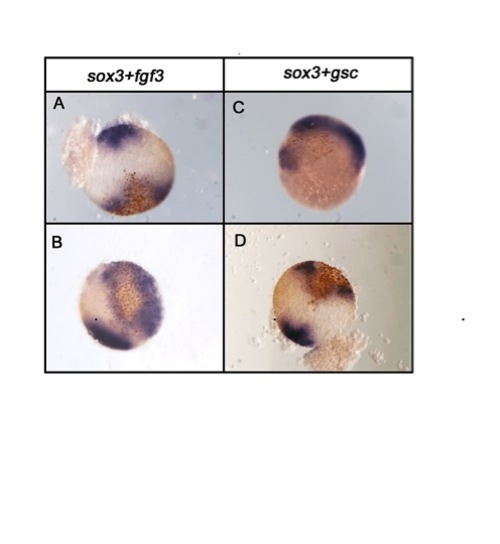
When Sox3 is coinjected with FGF3 or Gsc, gaps in ectopically-induced Chd expression coincide with the region of highest sox3 expression. Embryos were injected with 50 pg of sox3 plus 50 pg of either fgf3 RNA (A,B) or gsc RNA (C,D) and analysed for chd expression (blue/purple) at 4.5 hpf. Sox3 and gsc protein was detected by virtue of the HA tags they carried, using a brown peroxidase substrate. In each case the predominant region of sox3 overexpression corresponded with a gap in the region of ectopically-induced chd expression although there was often some overlap where deeper chd-expressing cells appeared to be overlaid by weaker sox3 overexpressing cells nearer the surface. Viewed from animal pole. |

Sox3 overexpression is able to inhibit the ectopic expression of chd induced by a range and combination of upstream factors. Embryos were injected with 50 pg of various RNAs (indicated above each panel) alone or combination and analysed for chd expression at 4.5 hpf (A). Injection of boz, fgf3, or boz combined with fgf3, caused expansion of chd expression into the animal hemisphere of embryos (Ab–d). Injection of the additional up-stream factors, S37A (constitutive active β-catenin) and sqt strongly induced expansion of chd throughout the entire animal hemisphere (Ae). However, co-injected with sox3 (B) led to reduced expansion or negative patches in the expansion of chd expression no matter which other factors were injected. Although the combination of all factors still gave strongest extopic expression, co-injection of sox3 was still able to generate chd negative patches (Be). Lateral view and dorsal is to the right in upper panels, viewed from animal pole in lower panels. The proportion of embryos exhibiting these phenotypes is shown at the bottom right of each panel. |
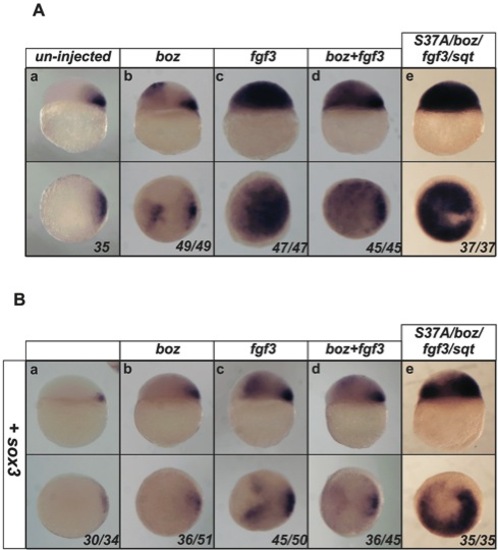
Sox3 overexpression is able to inhibit the ectopic expression of gsc induced by a range and combination of upstream factors. Embryos were injected with 50 pg of various RNAs (indicated above each panel) alone or combination and analysed for gsc (A) expression at 4.5 hpf. Injection of boz, fgf3, or boz combined with fgf3, caused expansion of gsc expression into the animal hemisphere of embryos (Ab–d). Injection of the additional up-stream factors, S37A (constitutive active β-catenin) and sqt strongly induced expansion of gsc throughout the entire animal hemisphere (Ae). However, co-injection with sox3 (B) reduced the expansion of expression of gsc expression or generated negative patches in the expansion of gsc expression no matter which other factors were injected. Although the combination of all factors still gave strongest ectopic expression, co-injection of sox3 was still able to generate gsc negative patches (Be). Lateral view and dorsal is to the right in upper panels, viewed from animal pole in lower panels. The proportion of embryos exhibiting these phenotypes is shown at the bottom right of each panel. |