- Title
-
Hypoxia/Reoxygenation cardiac injury and regeneration in zebrafish adult heart
- Authors
- Parente, V., Balasso, S., Pompilio, G., Verduci, L., Colombo, G.I., Milano, G., Guerrini, U., Squadroni, L., Cotelli, F., Pozzoli, O., and Capogrossi, M.C.
- Source
- Full text @ PLoS One
|
Oxidative stress detection after H/R in vivo. DHE staining (a-d) and N-Tyr immunofluorescence (e-f) of hearts under control conditions (C) and exposed to H/R. (a) Representative confocal microscopy images of DHE staining in C and 2 h after H/R. (b) Merge of DHE and Hoechst nuclear staining. Calibration bar = 20 µm. White arrow-heads indicate DHE+ nuclei. (c) 3D representation of DHE fluorescence intensity distribution in the analyzed area: the z-axis shows the fluorescence intensity in cardiac nuclei, the y-axis and x-axis show the spatial distribution of nuclei on a plane. (d) Graph shows Mean Fluorescence Intensity (MFI) in C and 2 h to 14 h after H/R (n = 4 at each time point; ** p<0.01 vs. C). Time course analysis revealed a peak of oxidative stress at 2 h in zebrafish adult heart sections, detected by DHE staining. (e) Representative confocal microscopy images of N-Tyr immunofluorescence, where green fluorescence indicates anti-N-Tyr and Hoechst nuclei staining: control (C, left panel) and 2 h after H/R (right panel). Calibration bar = 10µm. (f) Graph shows Mean Fluorescence Intensity (MFI) in C and 2 h to 14 h after H/R (n = 4 at each time point; ** p<0.01 vs. C). H/R induced protein nitrosylation with a peak effect at the 2 h time point. |
|
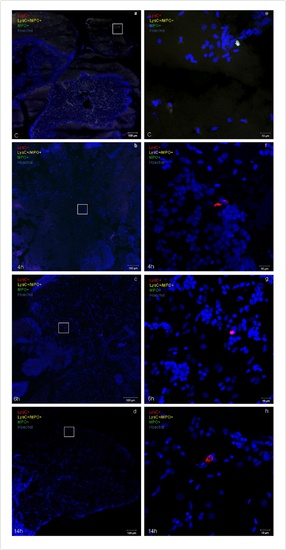
Inflammatory response induced by H/R in vivo. Representative confocal microscopy images (a-h) showing neutrophils (yellow fluorescence or green fluorescence) and macrophages (red fluorescence) infiltration in double transgenic line Tg(MPO:EGFP)×Tg(LysC:DsRed) in control (C) and at different time points (4 h, 6 h, and 14 h) after H/R. Neutrophils are either yellow (LysC+/MPO+) or green (predominantly, MPO+) cells (arrows in the 6 h image); red macrophages are LysC+ cells (arrow in the 4 h image). Hoechst stains cell nuclei; (a-d) calibration bar = 100 µm, (e-h) calibration bar = 20 µm.The peak inflammatory response occurred at the 6 h time point after H/R This experiment was performed three times with similar results. EXPRESSION / LABELING:
|
|
Apoptotic myocyte cell death induced by H/R in vivo. Apoptotic myocyte cell death was assessed under baseline conditions, and 18 h and 30d after H/R in the Tg(cmlc2:nucDsRed) zebrafish line. At 18 h after H/R it was found a marked increase in apoptotic myocardial cell number, which was back to control value at the 30d time point. (a) Representative image of a zebrafish heart ventricular section 18 h after H/R, showing colocalization of DAPI, DsRED and TUNEL stainings. Arrows indicate cardiomyocyte TUNEL+ nuclei, whereas arrow-head indicates non-cardiomyocyte TUNEL+ nuclei. (b) TUNEL+ cardiomyocytes nuclei in control (C) animals, and 18 h and 30d after H/R (n = 3 at each time point; * p<0.05 vs. C). |
|
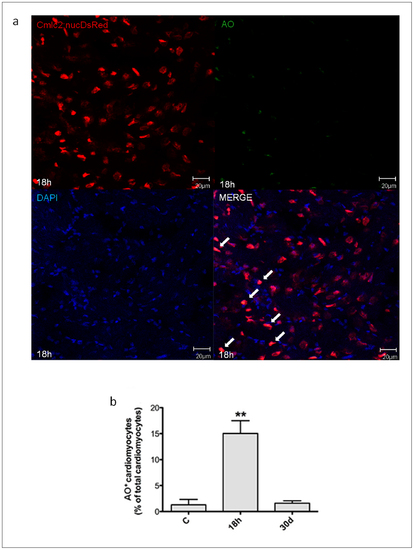
Necrotic myocyte cell death induced by H/R in vivo. Necrotic myocyte cell death was assessed under baseline conditions, and 18 h and 30d after H/R in the Tg(cmlc2:nucDsRed) zebrafish line. At 18 h after H/R it was found a marked increase in necrotic myocardial cell number, which was back to control value at the 30d time point. (a) Representative image of a zebrafish heart ventricular section 18 h after H/R showing colocalization of DAPI, DsRED and AO stainings. Arrows indicate cardiomyocyte AO+ nuclei. (b) AO+ cardiomyocytes nuclei in control (C) animals, and 18 h and 30d after H/R (n = 3 at each time point; ** p<0.01 vs. C). |
|
Myocardial cells positive for pHH3 induced by H/R in vivo. Cardiomyocytes proliferation was assessed under baseline conditions and 18 h to 30d after H/R in Tg(cmlc2:nucDsRed) zebrafish line. (a) Representative image of a zebrafish heart ventricular section 3d after H/R showing colocalization of DAPI, DsRED and pHH3 stainings. Arrows indicate cardiomyocyte pHH3+ nuclei. (b) The increase in pHH3+ cardiomyocytes was apparent 18 h after H/R, achieved its peak at the 7d time point and was back to baseline at the 30d time point (n = 3 at each time point; ** p<0.01 and *** p<0.001 vs. C). |
|
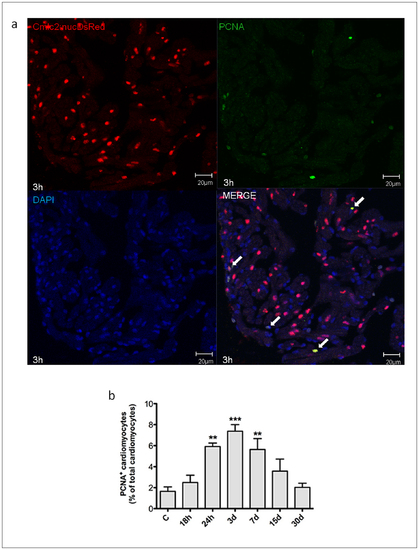
Myocardial cells positive for PCNA induced by H/R in vivo. Cardiomyocytes proliferation was assessed under baseline conditions and 18 h to 30d after H/R in Tg(cmlc2:nucDsRed) zebrafish line. (a) Representative image of a zebrafish heart ventricular section 18 h after H/R showing colocalization of DAPI, DsRed and PCNA stainings. Arrows indicate cardiomyocyte PCNA+ nuclei. (b) Following H/R, there was a progressive increase in PCNA+ cardiomyocytes nuclei; the peak increase was achieved at the 3d time point, and at 30d the number of PCNA+ myocardial cells was back to control value (n = 3 at each time point; ** p<0.01 and *** p<0.001 vs. C). |
|
Oxidative stress detection by DHE fluorescence after H/R in vivo.(a) Representative confocal microscopy images of DHE staining at 6 and 14 h after H/R. (b) Merge of DHE and Hoechst nuclear staining. Calibration bar = 20 µm. White arrow-heads indicate DHE+ nuclei. (c) 3D representation of DHE fluorescence intensity distribution in the analyzed area: the z-axis shows the fluorescence intensity in cardiac nuclei, the y-axis and x-axis show the spatial distribution of nuclei on a plane. |
|
Brain inflammatory response induced by H/R in vivo. (a–h) Representative confocal microscopy images showing neutrophils (yellow or green fluorescence) and macrophages (red fluorescence) infiltration in double transgenic line Tg(MPO:EGFP)×Tg(LysC:DsRed) in control (C) and at different time points (4 h, 6 h, and 14 h) after H/R. Hoechst stains cell nuclei. (n = 3). (a–d) calibration bar = 100 µm, (e–h) calibration bar = 10 µm. |
|
Liver inflammatory response induced by H/R in vivo. (a–h) Representative confocal microscopy images showing neutrophils (yellow or green fluorescence) and macrophages (red fluorescence) infiltration in double transgenic line Tg(MPO:EGFP)×Tg(LysC:DsRed) in control (C) and at different time points (4 h, 6 h, and 14 h) after H/R. Hoechst stains cell nuclei. (n = 3). (a–d) calibration bar = 100 µm, (e–h) calibration bar = 10 µm. |
|
Masson Trichrome Staining. (a–f) Masson trichrome staining in control (C), at 3 h and 30d after H/R. (n = 3) (a–c) calibration bar = 100 µm, (d–f) calibration bar = 50 µm. |


