- Title
-
The differentiation and movement of presomitic mesoderm progenitor cells are controlled by Mesogenin 1
- Authors
- Fior, R., Maxwell, A.A., Ma, T.P., Vezzaro, A., Moens, C.B., Amacher, S.L., Lewis, J., and Saúde, L.
- Source
- Full text @ Development
|
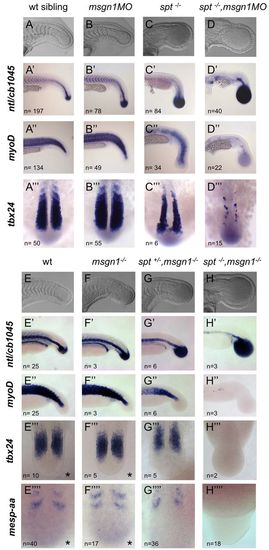
Msgn1 and Spt are essential for tail somite formation. (A-D,E-H) Live zebrafish embryos typical of their genotypic classes. (A′-D′′ ′,E′-H′′ ′ ′) In situ hybridisation for ntl and cb1045 (xirp2a), myoD (myod1), tbx24 and mespaa expression in uninjected wild-type (wt) siblings and in the genotypes indicated. spt-/- mutants were derived from a heterozygous spt+/- cross. msgn1-/- mutants, spt+/-;msgn1-/- mutants and spt-/-;msgn1-/- double mutants were derived from a double heterozygous msgn1+/-;spt+/- cross. Indicated is the number of embryos (n) observed with the phenotype shown in each panel, and when embryos were derived from mutant crosses the obtained n corresponded to the expected frequencies for each genotype. Asterisk indicates that wt and msgn1 mutants have an undistinguishable phenotype at the 14-somite stage. EXPRESSION / LABELING:
PHENOTYPE:
|
|
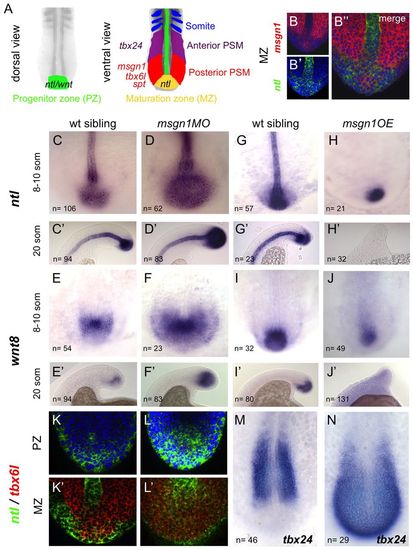
Msgn1 regulates the transition from the maturation zone to the PSM. (A) Diagram of sequential gene expression as a mesodermal cell progresses from a progenitor state in the dorsal superficial tailbud until incorporation into a somite. (B-B′′) Double fluorescent in situ hybridisation for msgn1 (red) and ntl (green) in a wt zebrafish embryo. (C-J′) Expression of ntl (C-H2) and wnt8 (E-J2) in msgn1MO-injected embryos (D,D′,F,F′) and their siblings (C,C′,E,E′) and in embryos overexpressing msgn1 (H,H′,J,J′) and their siblings (G,G′,I,I′). At the 8- to 10-somite stage (H), 55% of msgn1-overexpressing embryos showed an absence of notochord ntl staining and 33% presented notochord breaks, but some expression of ntl was still evident in the tailbud. At the 20-somite stage (H′), 88% of these embryos showed an absence of ntl staining in the tailbud; this 88% consisted of 66% that showed no notochordal ntl expression and 22% that showed some notochord staining. In both H and H′, 12% of the injected embryos appeared wt. Seventy per cent of msgn1OE embryos showed continuing but strongly downregulated wnt8 staining at the 8- to 10-somite stage (J); the remaining 30% exhibited a total absence of wnt8 expression. By the 20-somite stage (J′), expression of wnt8 had disappeared completely. (K-L′) Confocal images of double fluorescent in situ hybridisation showing expression of ntl (green) and tbx6l (red) in a msgn1MO-injected embryo (L,L′) and an uninjected sibling (K,K′) at the 8- to 10-somite stage, in the superficial dorsal progenitor region (K,L) and at the level of the notochord, where ntl and tbx6l expression overlap (K′,L′). (M,N) Expression of tbx24 in a msgn1 mRNA-injected embryo (N) and its sibling control (M) at the 8- to 10-somite stage. EXPRESSION / LABELING:
PHENOTYPE:
|
|
A heat shock-driven pulse of Msgn1 inhibits expression of progenitor-specific genes and drives progression through the PSM differentiation program. Batches of zebrafish embryos comprising heat shocked hsp70:HA-msgn1 transgenics along with wt sibling controls were analysed; ~50% of each batch showed a clear phenotype and were presumed to be the transgenics. (A-D′) Expression of ntl, wnt8, wnt3a and fgf8 after 1 hour of recovery post-heat shock (hpHS) in hsp70:HA-msgn1 embryos (A′-D′) and their wt siblings (A-D) heat shocked for 1 hour at the 13-somite stage. In the transgenics (32/59 embryos), tailbud expression of ntl was severely reduced (29/59 embryos) or totally eliminated (3/59 embryos). Tailbud expression of wnt8 in the transgenics (35/65 embryos) was also strongly reduced, but reduction in expression levels of wnt3a and fgf8 at this early time after heat shock was milder, making transgenics often hard to distinguish from sibling controls. (E,E′) tbx24 expression at 2 hpHS. In the hsp70:HA-msgn1 transgenics (29/76 embryos), tbx24 expression is intensified in the PSM and abnormally extended into the region of formed somites, but is still absent from the tailbud. (F,F′) fgf8 expression at 2 hpHS. In the hsp70:HA-msgn1 transgenics (10/23 embryos), fgf8 is downregulated but still detectable. (G-M′) Expression of ntl, wnt8, wnt3a, fgf8, tbx24 and tbx6l at 7 hpHS. In the hsp70:HA-msgn1 transgenics (G′, n=25/53; H′, n=46/92; I′, n=13/29; J2, n=32/66; K′, n=15/34; M′, n=10/22), the tailbud has now lost all expression of ntl, wnt3, wnt8 and fgf8 and instead expresses tbx24 and tbx6I. Asterisks, arrowhead and hash sign indicate ectopic expression of tbx24 in somites, tailbud and midline, respectively. EXPRESSION / LABELING:
PHENOTYPE:
|
|
Transient inhibition of Wnt signalling by Dkk1 allows ectopic activation of tbx24 in the most posterior region of the PSM. Batches of zebrafish embryos comprising heat shocked hsp70:dkk1 transgenics along with wt sibling controls were analysed. tbx24 expression is shown at 4 hours of recovery after a 30-minute heat shock at the 13-somite stage, in lateral (left of each pair) and flatmount dorsal (right of each pair) views. Arrowhead indicates a posterior expansion into the tailbud of tbx24 expression; bracket highlights the reduction of the tailbud region. EXPRESSION / LABELING:
PHENOTYPE:
|
|
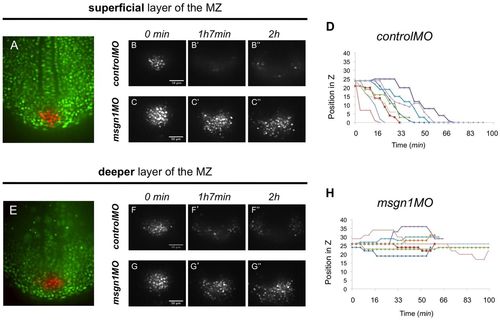
Msgn1 controls cell movements in the neighbourhood of the tailbud. (A) An 8-somite stage Kaede-injected zebrafish embryo with a patch of tailbud cells freshly photoactivated (red), imaged in the plane of the notochord and adaxial cells [i.e. in the superficial layer of the maturation zone (MZ)]. (B-C′′) Dispersion of the photoactivated tailbud cells imaged in this plane in controlMO (B-B′′, Movie 1) and msgn1MO (C-C′′, Movie 3) morphants. (E) An 8-somite stage embryo with photoactivated tailbud cells (red) imaged in a deeper layer, ~20 μm ventral to the notochord and adaxial cells (i.e. in a deep layer of the MZ). (F-G′′) Dispersion of the photoactivated tailbud cells imaged in this plane in controlMO (F-F′′, Movie 2) and msgn1MO (G-G′′, Movie 4) morphants. (D,H) z-position of individual Kaede photoactivated tailbud cells tracked over time in controlMO (D) and msgn1MO (H) morphants. Each colour represents an individual cell. Loss of msgn1 leads to failure of ventral diving and of the subsequent lateral dispersion. Scale bars: 50 μm. PHENOTYPE:
|
|
Msgn1 regulates snail1a expression. (A-A′′) Double fluorescent in situ hybridisation for msgn1 (red) and snail1a (green) in a 10-somite stage wt zebrafish embryo, as seen in confocal section. (B-E) Expression of snail1a is increased in msgn1MO morphants (D,E) compared with sibling controls (B,C). (F,G) Expression of snail1a is decreased in hsp70:HA-msgn1 embryos (G) compared with sibling controls (F) at 1 hpHS. (H) An 8-somite stage Kaede-injected embryo with freshly photoactivated cells (red) in the superficial layer of the MZ (region 1), in the posterior PSM (region 2), and in the anterior PSM (region 3). (I) z-position of individual cells photoactivated in region 1 in snail1aMO morphants, tracked over time. Each colour represents an individual cell. Compare with Fig. 5D,H. (J) Mean ventral diving velocities of cells marked by photoactivation in region 1, comparing wt control, msgn1MO and snail1aMO morphants. Mean ± s.d., ***P<0.0005 versus wt controls (t-test). (K-P2) Still images showing the tracks of posterior and anterior PSM photoactivated cells in wt control (K-L′), msgn1MO-injected (M-N′) and snail1aMO-injected (O-P′) embryos. The boxed regions in K-P are magnified in K′-P′. Scale bar: 50 μm. EXPRESSION / LABELING:
PHENOTYPE:
|
|
Loss of Msgn1 affects somite number and size. Somite numbers and somite size in wt zebrafish embryos (blue and light blue), msgn1-/- single mutants, spt+/-;msgn1-/- double mutants and msgn1MO-injected embryos (colours as indicated in E-I), fixed at 36 hours postfertilisation and measured after staining by in situ hybridisation with cb1045 to show somite boundaries. (A) Distribution of the total number of somites in the different genotypes. The peak of the distribution is at 32 somites for wt, 33 somites for msgn1MO, 33 somites for msgn1-/-, and 34/35 somites for spt+/-;msgn1-/-. (B) The mean (±s.d.) number of somites for each genotype. *P<0.01, **P<0.005, ***P<0.0005, versus wt; t-test. (C) Size of somites as a function of position along the A/P body axis in msgn1MO morphants and wt siblings. (D) The mean (±s.d.) somite size in msgn1MO morphants and wt siblings. (E-I) Representative stained embryos of each genotype. The red dot in each case marks the thirtieth somite; black dots mark somites posterior to this. |
|
Loss of msgn1 does not enhance the tail deficiency of ntl–/– mutants. The progeny of a double heterozygous msgn1+/– ;ntl+/– cross were sorted into three distinguishable phenotypic classes and subsequent genotyping showed that embryos with a normal tail phenotype were wt (A), embryos with an enlarged tailbud were msgn1–/– (B) and embryos with similar severe tail truncations were either ntl–/– or msgn1–/–;ntl–/– double mutants (C). Genotypes were present at the expected ratios. |
|
Msgn1 regulates posterior development. (A,E,I) Live images of wt (A), msgn1MO-injected (E) and msgn1- overexpressing (I) embryos. (B-D,F-H,J-L) Nuclei (DAPI, blue) and F-actin (phalloidin, green) staining of wt (B-D), msgn1MO-injected (F-H) and msgn1-overexpressing (J-L) embryos. (B,F,J) Confocal sections at the level of the tailbud (B,F,J), the trunk somites (C,G,K) and the notochord (D,H,L). |
|
Generation and validation of the hsp70:HA-msgn1 transgenic line. (A) The construct used to generate the hsp70:HA-msgn1 transgenic line. The N-terminus of the msgn1 gene was fused with an HA tag and placed under an hsp70 promoter. In addition, the b-crystallin promoter was used to drive CFP in the lens to facilitate identification of transgenic embryos. (B-N′) Embryos were obtained from a cross between hsp70:HA-msgn1 heterozygous and wt fish, generating a batch with an expected frequency of 50% transgenics and 50% wt control siblings. (B-E′) In situ hybridisation showing msgn1 mRNA levels in hsp70:HA-msgn1 transgenic embryos and their wt sibling controls, with no heat shock (B) or heat shocked for 1 hour at the 13-somite stage and fixed immediately (C,C′), 2 hpHS (D,D′) and 7 hpHS (E,E′). (F-K′) Levels of HA-tagged Msgn1 protein (FH′) at the level of the tenth somite in hsp70:HA-msgn1 transgenic embryos fixed immediately after heat shock (0 hpHS), 2 hpHS and 7 hpHS and their corresponding control siblings. (I-K′) The same embryos as in F-H′ counterstained with DAPI to reveal the nuclei. (L-N′) Expression of ntl, wnt8 and tbx24 in hsp70:HA-msgn1 transgenic embryos and their respective control siblings heat shocked for 1 hour at the 7-somite stage and fixed 7 hpHS. Red arrowhead, ectopic expression of tbx24 in the tailbud. hpHS, hours post-heat shock. |
|
Regulation of msgn1 expression during segmentation. (A,A′) Similar expression of msgn1 in the presomitic mesoderm of 8-somite stage embryos was detected in wt siblings (A) and msgn1–/– embryos (A′). (B,B′) With no heat shock, a normal pattern of expression of msgn1 is observed in hsp70:ntl injected embryos and their uninjected siblings. (C-F′) All embryos were heat shocked for 30 minutes at the 13-somite stage. (C,C′) Ectopic expression of msgn1 is induced in hsp70:ntl injected embryos when compared with their uninjected siblings. (D,D′) A complete absence of msgn1 expression is observed in hsp70:dnfgfr1 transgenic embryos when compared with their siblings. (E,E′) Ectopic expression of msgn1 is induced in hsp70:caβcat injected embryos when compared with their uninjected siblings. (F,F′) A severe downregulation of msgn1 expression is observed in hsp70:dkk1 transgenic embryos when compared with their siblings. Transgenic embryos were obtained from a cross between heterozygous transgenics and wt fish, generating batches with the expected frequency of 50% transgenics and 50% wt control siblings. |
|
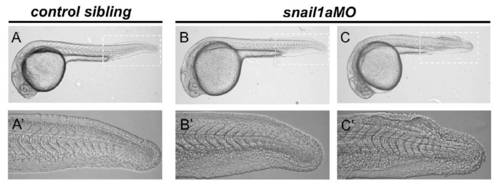
The mild snail1a loss-of-function phenotype. Eighty percent (n=123, three different batches) of the snail1aMO-injected embryos (B,B′) show an indistinguishable phenotype from controls (A,A′) and 20% show a fin-fold phenotype (C,C′). (A′-C′) Magnification of the tail region corresponding to the embryos shown in A-C. |


