
- Title
-
Autotaxin/Lpar3 signaling regulates Kupffer's vesicle formation and left-right asymmetry in zebrafish
- Authors
- Lai, S.L., Yao, W.L., Tsao, K.C., Houben, A.J., Albers, H.M., Ovaa, H., Moolenaar, W.H., and Lee, S.J.
- Source
- Full text @ Development

The Atx-Lpar3 axis mediates cardiac laterality. (A-P) Zebrafish embryos injected with 5 ng of different MOs were examined for cardiac jogging at 24 hpf (A-G) or cardiac looping at 48 hpf (H-N) by WISH against cmlc2. Representative heart phenotypes are shown for embryos injected with MOs as follows: (A,B,E) left-jogging, (C,F) no-jogging, (D,G) right-jogging, (H,I,L) D-looping, (J,M) no-loop and (K,N) L-looping hearts. In three trials, the percentages of embryos with different heart jogging (O, 24 hpf) and looping phenotypes (P, 48 hpf) are presented. (Q) Embryos were injected with 2.5 ng Std MO, lpar3 MO or atx MO with or without 100 pg lpar3 mRNA. The percentages of embryos with different heart jogging phenotypes are shown (n=3). (R) Cardiac jogging of wild-type embryos and atx morphants injected with 2.3 nl of buffer or 0.25 mM LPA (pipette concentration) into the yolk syncytial layer at the 512-cell stage was examined and quantified (n=3). Total number of embryos used in each treatment is shown on top of each column for all bar graphs. a, b, c, groups denoted with different lettering refer to statistical significance (P<0.05). |

Asymmetric gene expression is disturbed in lpar3 and atx morphants. (A-O) WISH of asymmetry genes spaw (A-E), pitx2 (F-J) and lefty1 and lefty2 (K-O) in zebrafish embryos injected with designated MOs are shown. Open arrowheads, lateral plate mesoderm; arrow, diencephalon; solid arrowheads, heart precursor. (P-R) Asymmetry genes spaw (P), pitx2 (Q) and leftys (R) were quantified in MO-injected embryos. For each treatment, embryos from two independent batches were analyzed. Gene expression in diencephalon (labeled B) and heart precursor (labeled H) were analyzed separately in R. EXPRESSION / LABELING:
PHENOTYPE:
|

Kupffer′s vesicle formation is disturbed in both lpar3 and atx morphants. (A-J,N) Tg(sox17:dsRed) zebrafish embryos were injected with MO and the integrity of KV was examined under differential interference contrast (A-E) or epifluorescence (F-J) microscopy. In contrast to Std control MO-injected embryos (A,F), deformed (B,G,D,I) and/or reduced KVs (C,H,E,J) were observed in both lpar3 and atx morphants (open arrowheads). In addition, dispersed dsRed-positive cells (arrowheads) were also observed around KV in both lpar3 and atx morphants. To quantify KV defects, Tg(sox17:dsRed) embryos were used to repeat the above experiments and analyses are shown in N. (K-M,O) Embryos injected with the indicated MO were subjected to WISH against charon (cha, ventral view, bottom right). Arrowheads point to KVs. Magnified KV insets are shown at the lower right of each panel; embryo midlines are indicated by dashed lines. WISH against charon also revealed similar deformed/reduced pattern in lpar3 (L) and atx (M) morphants compared with Std control MO-injected embryos (K). Quantitative analyses are shown in O. PHENOTYPE:
|
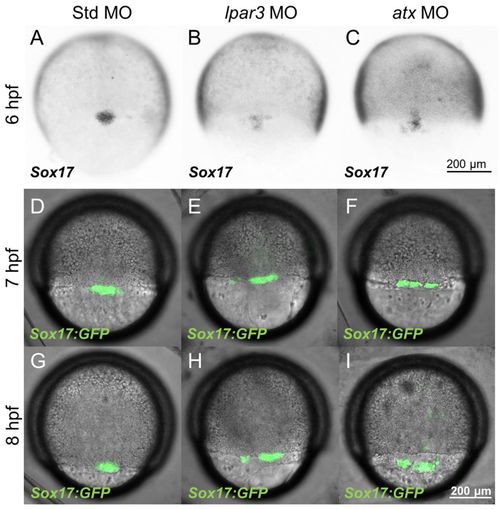
DFC clustering is disturbed in lpar3 and atx morphants during epiboly. (A-C) Zebrafish embryos injected with the indicated MOs were subjected to WISH against sox17 at 6 hpf. In contrast to the ovoid-shaped DFCs cluster in Std MO-injected embryos (A), dispersed DFC clusters were observed in both lpar3 (B) and atx (C) morphants. (D-I) Tg (sox17:GFP) embryos were MO injected, cultured to 7 hpf and 8 hpf, and photographed under epifluorescence DIC microscopy. The DIC and epifluorescence images are superimposed and presented. More spread-out and linear-shaped DFCs were observed in both lpar3 (E,H) and atx (F,I) morphants compared with Std MO-injected embryos (D,G). EXPRESSION / LABELING:
PHENOTYPE:
|

KV ciliogenesis is disturbed in lpar3 and atx morphants. (A-C) Cilia in KV for the indicated treatments were observed by immunofluorescence using anti-acetylated tubulin antibody (red) and counter-stained with aPKC antibody (green) to outline the KV. Representative photographs of Std MO-injected zebrafish embryos (A), lpar3 (B) and atx (C) morphants are presented (anterior side up). (D,E) Ten embryos were used for each treatment (three independent experiments) to measure cilia number (D) and volume (E). The number of embryos examined is presented in each column. Error bars represent s.e.m. a, b, groups denoted with different lettering refer to statistical significance (P<0.05). PHENOTYPE:
|
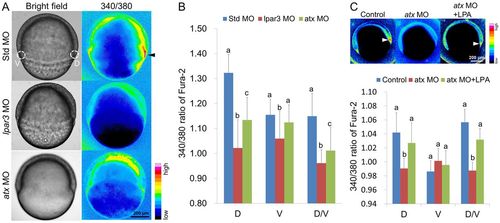
Calcium rise in the DFCs is abolished in lpar3 and atx morphants. (A) Zebrafish embryos were injected with the indicated MOs and fura-2 dextran, incubated to the shield stage and photographed under bright and dark field. The dark-field images were converted to 16-color intensity images (intensity bar is shown in the bottom right corner of A) using Image J software. The shield showed higher calcium levels in control embryos (with peak levels in DFCs; black arrowhead) than those in lpar3 and atx morphants. (B) The peak 340/380 nm ratio in the shield/DFCs region (cycles at the dorsal side) and the ventral blastoderm region (cycles at the ventral side) were measured using Image J software (n=10 for each treatment from three independent experiments). The dorsal, ventral and dorsal/ventral 340/380 nm ratios are shown. (C) Similar analysis was applied in atx morphants with additional DFC-targeting LPA delivery. LPA restores the calcium signal in the shield/DFC region. a, b, c, groups denoted with different lettering refer to statistical significance (P<0.05). PHENOTYPE:
|

Targeted knockdown of lpar3 or atx in DFCs causes cardiac bifida in addition to laterality defects. (A) Zebrafish embryos at the 512- to 1000-cell stage were injected with 2.5 or 5 ng of the indicated MOs with or without 100 pg of lpar3 mRNA, as shown at the bottom of each column. Treated embryos were cultured until 26-28 hpf and then subjected to cardiac jogging analysis. The percentages of each phenotype in all treatments are shown in the lower graph. a-f, groups denoted with different lettering refer to statistical significance (P<0.05). (n=3). (B) Embryos with the indicated treatments were incubated to 48 hpf and then subjected to cardiac looping analysis. |
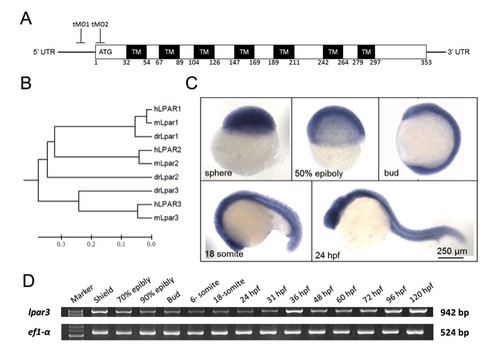
Sequence analysis and expression profile of zebrafish lpar3 gene. (A) Domain architecture of the G protein-coupled receptor Lpar3 in zebrafish. Lpar3 possesses evolutionarily conserved seven transmembrane domains (TMs) and translation-blocking MOs (tMO1 and tMO2) binding sites are indicated. Amino numbers flanking each transmembrane domain are shown. (B) Phylogenetic analysis of LPA receptors 1-3 from human (hLPAR1-3), mouse (mLpar1-3) and zebrafish (drLpar1-3). (C,D) WISH expression patterns (C) and RT-PCR analysis (D) of lpar3 in zebrafish embryos at the designated stages. ef1-α was used as an internal control. |
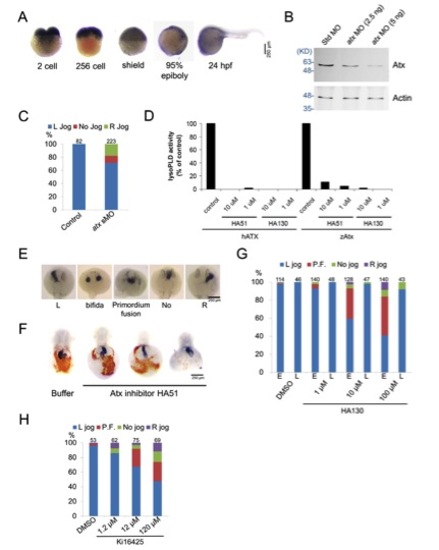
Characterization of zebrafish Atx. (A) Expression patterns of zebrafish Atx during early development was observed by WISH. (B) Embryos injected with 5 ng Std MO, or 2.5 or 5 ng atx MO were cultured to shield stage and subjected to western blotting analysis. Expression of Atx was dose-dependently inhibited by atx MO. Molecular weight is shown in KD on the left-hand side. (C) Uninjected embryos and embryos injected with 2.5 ng of an atx splicing blocking MO (sMO) were incubated to 26-28 hfp and subjected to cardiac jogging analysis by WISH against cmlc2. Total number of embryos used in each treatment is shown on top of each column hereafter. (D) Human ATX (hATX) and zebrafish Atx (drATX) were expressed in HEK293T cells. LysoPLD activity of secreted Atx in the medium was measured by hydrolysis of FS3 (2.5 mM) as described in Materials and methods. (E) Representative patterns of cardiac jogging phenotypes in Atx- LPAR3 loss-of-function conditions. (F) Embryos were injected with or without HA51 at the one-cell stage, incubated and fixed at 48 hpf. Fixed embryos were subjected to o-dianosidine staining and WISH against cmlc2. Representative images are shown. (G) Cardiac jogging of embryos incubated with various concentrations of HA130 from 50% epiboly to tail bud stage (marked by ‘E’ for early) or embryos incubated with various concentrations of HA130 from 60% epiboly to tail bud stage (marked by ‘L’ for late) was examined and quantified (n=3). (H) Cardiac jogging of embryos incubated with various concentrations of Ki16425 from 50% epiboly to tail bud stage was examined and quantified (n=3). |

Knockdown of atx and/or lpar3 causes cardiac edema and blood pooling. (A,B) Embryos injected with atx or lpar3 MOs were examined and photographed at 24 (A) and 48 (B) hpf. Cardiac edema (filled arrowheads) and blood pooling (open arrowheads) appeared at the ventral side of the yolk in both atx and lpar3 morphants were observed (B). (C) Embryos injected with atx or lpar3 MOs were fixed and stained with o-dianosidine to reveal erythrocytes (brown staining). The treated embryos were positioned and photographed from the lateral view or ventral view. In the normal condition (top row), erythrocytes concentrated in pericardiac cavity (open arrowhead) and major vessels; however, in moderate defective embryos (middle row), erythrocytes spread out to the ventral side of the yolk (filled arrowhead); in the most severe condition (lower row), were reduced erythrocytes and hemorrhage in brain and/or eyes were sometimes observed (ventral view). (D) Dose-dependent disturbance of erythrocyte distribution was found in embryos injected with 1.25, 2.5 and 5 ng per embryo of lpar1, lpar3 or atx MOs. Std MO at 5 ng was used as a control (n=3). (E) Embryos were injected with single or different combinations of 1.25 ng of the indicated MOs. PHENOTYPE:
|

Atx-Lpar3 axis mediates gut looping. Embryos injected with 5 ng Std MO, lpar1 MO, lpar3 MO or atx MO were incubated until 48 hpf, fixed and subjected to WISH against foxA3. (A) Three representative gut looping phenotypes, including L-loop gut liver bud (Left), defected midline gut (Midline) and reversed R-loop gut (Reverse), were shown by WISH against foxA3 and insulin (ins). Insets showed corresponding cardiac looping patterns. (B) The percentages of each phenotype in all treatments are shown (n=3). Total number of embryos used in each treatment is shown on top of each column. PHENOTYPE:
|

KVs were deformed and dispersed in lpar3 and atx morphants. (A-F) GFP and DAPI merged images (A-C) and GFP image 3D stack model (D-F) of KV in control embryo (A), and lpar3 (B) and atx (C) morphants at the tail bud stage were examined and analyzed for cell dispersion and cell number under confocal microscopy. KV shown by GFP was from immunostaining of sox17:GFP embryos. |

DFC specification and cell number were not altered in lpar3 and atx morphants. (A-I) Wild-type (Wt) embryos, lpar3 and atx morphants were subjected to WISH against the DFC-specific marker ntl (A-F) at 60% epiboly and the six-somite stage (6 SS) and lrdr1 + lefty1 (G-I) at the ten-somite stage (10 SS; as indicated). Formation of DFCs and sustained expression of DFC-specific genes were observed in Wt embryos as well as in lpar3 and atx morphants at the stages indicated (open arrowheads). Notochord expression of both ntl and lefty1 were also observed (filled arrowheads). (J-O) Embryos were stained with vital dye SYTO-11 (10 mM) and examined at 6.5 hpf for DFCs endocytosis activity, cell clustering and cell number quantification. DFCs in lpar3 (K,N) and atx (L,O) morphants formed as early as those in Wt embryos (J,M), with similar numbers, but are more dispersed as linear pattern and sometimes even separate into two groups. |

Atx localizes in the shield during mid-epiboly stage. Atx was examined by immunofluorescence staining at the shield stage. (A) Atx was localized sporadically in blastomeres and concentrated in shield region (arrowheads) in control embryos. (B) The overall expression of Atx protein was notably reduced in atx morphants compared with that of control embryos. (C) When observed from the animal top view, Atx was found to be localized in shield blastomeres (arrowheads) in control embryos, but not those of atx morphants. EXPRESSION / LABELING:
|

Knockdown of Atx-Lpar3 signaling activates β-catenin. (A-C<) Wild-type (Wt) embryos (A), and lpar3 (B) and atx (C) morphants were fixed at the 60-70% epiboly stage and immunostained with anti-β-catenin (green) and DAPI (red). Forty-five stacks ranging from 8.3 to 12.45 mm below the surface was calculated for colocalization (as indicated by white signal) using ImageJ software, merged and shown. Nuclear β-catenin signal was stronger in lpar3 and atx morphants than in Wt embryos. (D) Forty-five stacks in five embryos with respective treatments were quantified. groups denoted with different lettering refer to statistical significance (P<0.05). |

DFC-targeted delivery of MOs. (A-H) Embryos at the 512-cell stage were injected with lpar3 MO with a 39 fluorescein modification into the YSL, cultured to mid-epiboly and examined at different magnifications under bright field (A-C) and dark field with a GFP cube (D-F). In addition to YSL, fluorescent MOs were enriched in DFCs (arrowheads in A-F), and also found in yolk (Y) and some tail cells at 24 hpf (arrowhead in H). |