
- Title
-
The alpha-Tocopherol Transfer Protein Is Essential for Vertebrate Embryogenesis
- Authors
- Miller, G.W., Ulatowski, L., Labut, E.M., Lebold, K.M., Manor, D., Atkinson, J., Barton, C.L., Tanguay, R.L., and Traber, M.G.
- Source
- Full text @ PLoS One
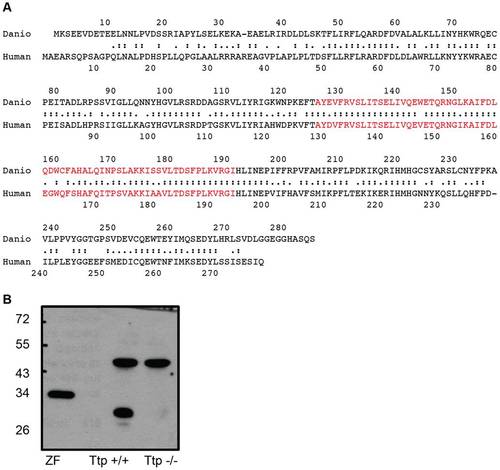
The zebrafish α-tocopherol transfer protein. A. Alignment of human and zebrafish TTP amino acid sequences is shown. Double dots indicate identical residues and single dots correspond to similar amino acids. Red text signifies α-tocopherol binding pocket. Align2 software (http://bioinfo.cgrb.oregonstate.edu/fast a2.html. Accessed 2012 Sep 17.) was used for sequence comparison. Sequences were obtained from NCBI. B. Anti-human TTP antibody cross-reacts with TTP from adult zebrafish liver homogenate. The 33 kD zebrafish protein (left lane) shown with a Ttp-/- mouse sample as a negative control (right lane) and a WT mouse sample with the 32 kD mouse homolog (left lane). |

TTP expression is dynamic in the developing zebrafish. A. Embryonic TTP transcription increases during the first 24 hpf. Expression normalized to odc1 expression, and values are expressed as fold change compared to 6 hpf. Data shown as mean ± SEM, 6 hpf n = 4, 9–12 n = 6, 13–18 n = 9, and 19–24 n = 11 replicates (30 embryos per replicate). B-G. Whole mount in situ hybridization of ttpa reveals the patterning of mRNA expression. B. A lateral view of a whole mount embryo at 12 hpf shows fairly even distribution, however, in C a dorsal view of the rostral region with the yolk removed shows specific staining along what may be the developing neural tube. D. At 17 hpf expression remains along the length of the embryo, concentrating in the deeper cells, closer to the yolk sac. E. A dorsal view of the developing head at 17 hpf, the eyes and neural tube is where the expression appears to be localized (outlined). F. By 24 hpf the staining is seen only in the regions of the developing brain, eyes and tail bud. G. Dorsal view depicts brain and eye specific patterning. Yolk sacs were manually removed to reduce color interference, and for ease of positioning. fb = forebrain, mb = midbrain, * = midbrain-hindbrain boundary. |

Morpholino knockdown of TTP causes severe malformations. A. MO targeting schematic using a graphic representation of the ttpa transcript. The translational blocking morpholino (TRN) is complementary to the translation start-site, while the splice blocking morpholinos (EXC) bind to the intron/exon junctions on each side of the second exon. Arrows mark primers used to verify aberrant mRNA products resulting from the EXC morpholino (Figure S2). Numbered boxes represent exons, and spanning lines are introns, smaller unnumbered boxes are untranslated regions. B. TTP knockdown leads to high incidence of malformation within the first day of development. Data shown as mean percent incidence from seven (TRN, CTR and NON) or three separate experiments (EXC). C. Representative pictures of malformations at 1 dpf due to TTP knockdown. TRN = translational morpholino injected embryo, CTR = standard control injected embryo, concentration and age-matched to the TRN embryo. PHENOTYPE:
|

Early morphant malformations. Images of embryo development from 6–18 hpf demonstrating early effects of TTP knockdown (right panel) compared to an injected control animal at the same age (left panel). Embryos from each MO injection type remain constant through 11 hpf. Beginning at 12 hpf, malformations are noticeable in the rostral region of the TRN embryo. These initial malformations occur in the head at the time the developing eye (marked) becomes distinguishable. The malformations in TRN embryos are more pronounced at later stages of development (16 and 18 hpf), while somite formation continues unabated. Images are frames from a time-lapse video (Videos S1 and S2). PHENOTYPE:
|
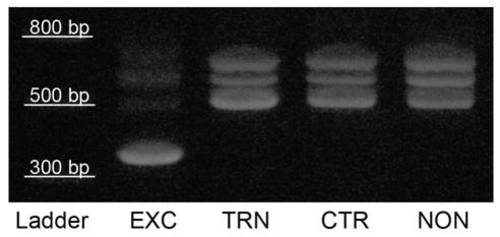
MO splice-blocking confirmation. PCR products created using primers flanking exon 2 in the TTP mRNA sequence are shown. Products from EXC injected embryos (EXC) display an aberrant transcript when compared to the other TTP knockdown (TRN), or the control groups (CTR and NON). The loss of exon 2 creates a single 346 base pair (bp) product, the proper transcript shows the expected three bands (the result of splice variants) all of which are larger than the EXC induced exon deletion (519–604 bp). |