- Title
-
High-throughput screening for bioactive molecules using primary cell culture of transgenic zebrafish embryos
- Authors
- Huang, H., Lindgren, A., Wu, X., Liu, N.A., and Lin, S.
- Source
- Full text @ Cell Rep.
|
Overall Strategy of Primary-Cell-Based High-Throughput Screening for Bioactive Small Molecules Using Cells Dissociated from Early Transgenic Zebrafish Embryos. |
|
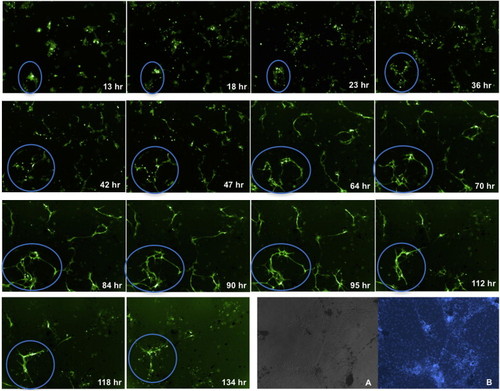
Differentiation of flk1-GFP-Labeled Endothelial Cells in Primary Culture Flk1-GFP expressing endothelial cells are scattered at day 1 and become flatten and elongated at days 2–4, undergoing tube formation. After 5–6 days of culture, GFP-positive cells start to die (blue circles). (A and B) Primary cells stained by (A) DIC and (B) Hoechst 33342 (5 μg/ml for 4.5–5 hr) on day 6. See also Figures S1 and S2. |
|
Flk1-GFP-Labeled Endothelial Cells Respond to Growth Factors and Small Molecules in Primary Culture (A–I) Endothelial cell proliferation and differentiation derived from Flk1-GFP are significantly promoted by 100 ng/ml bFGF (C, bright field, and D) compared with control (A, bright field, and B) at 22 hr after culture. Recombinant VEGF121 (20 ng/ml, F), small molecule SB-431542 (2 μM, G) and the combination of both (H) also remarkably enhance Flk1-GFP endothelial tube formation compared with control (E) at day 5, which exhibits a significant increase in total tube length (I-1, control; I-2, 2 μM SB431542; I-3, 20 ng/ml VEGF121; I-4, 2 μM SB431542 and 20 ng/ml VEGF121). The number values represent total tube length. See also Figure S3. |
|
Representative Images of Candidate Compounds that Promoted Endothelial Proliferation and Tube Formation at Day 5 (A) Control. (B–D) Candidate compounds. i19, g6, e9, g12, d16, and d13, original plate well ID. (E) 2 μM SB 431542. (F–H) Candidate compounds. i19, g6, e9, g12, d16, and d13, original plate well ID. See also Figures S4 and S5. |
|
Test of Candidate Compounds in Mammalian Cells (A) Candidate compounds enhanced HUVEC proliferation significantly at 1 μM or 10 μM (p = 0.0007, 0.005, 9.20E-05, 0.001, 1.40E-06, 0.021, 0.009, 2.70E-05, 0.02, 0.02,1.00E-6, and 2.0E-04 for SB431542, A65, A79, A69, A86, A54, A36, Gh, Nd, Dip, Fh, and SST, respectively) compared with 1% DMSO control. Data from four independent experiments were analyzed. (B–E) Candidate compounds enhanced HUVEC migration. HUVEC migration was analyzed 24 hr after scratch wounds and drugs were added (B, C, D, and E at 0 hr; B2, C2, D2, and E2 at 24 hr after treatment). Migration distances were measured in micrometers and marked with white arrowheads. (F) Akt phosphorylation levels increased in HUVECs by candidate compounds. Akt phosphorylation assay was performed using HUVECs treated with candidate small molecules for 8 hr (A65, A86, Dip, and Fh) and positive compound (SB) compared with DMSO control. (G) Western blot band intensity was analyzed using the ImageJ program. After normalization against total Akt levels and β-actin levels, the compounds enhanced Akt phosphorylation levels by 1.6- to 6.5-fold compared with DMSO control. (H) Candidate compounds promoted Flk1 expression in differentiating mESCs. Cells were analyzed on day 4 of differentiation by flow cytometry for percentage of Flk1+. Expression levels were normalized to levels with DMSO. See also Figure S6. |
|
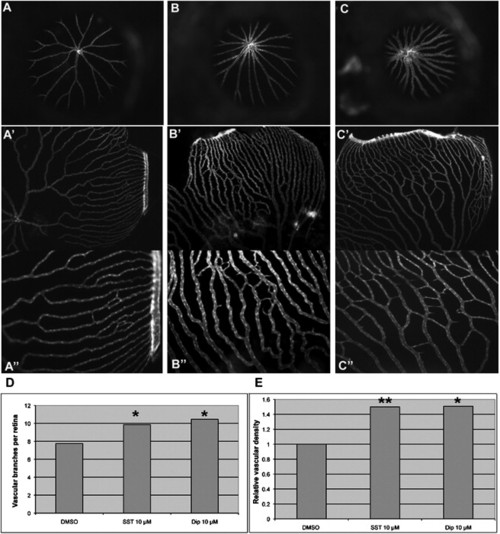
Test of Selected Candidate Compounds in Vivo (A–C) Representative images of retinal vasculature treated with DMSO, SST, and Dip. (A, A2, and A3) 0.5% DMSO. (B, B2, and B3) 10 μM SST. (C, C2, and C3) 10 μM Dip. (A–C) Frontal view of retinal vasculature after removal of cornea and lens of Flk1-GFP transgenic adult eyes without flat mount. (A2–C3) Frontal view after flat mount. (A3, B3, and C3) Higher magnification of A2, B2, and C2, respectively. (D and E) Quantifications of vessel number and relative density per eye, respectively. p = 0.0216 for SST and p = 0.022 for Dip against control in vessel numbers. p = 0.009 for SST and p = 0.025 for Dip against control in relative density. |
|
Differentiation of Primary Cells Derived from Additional Transgenic Embryos, Related to Figure 2 (A–F) Cells derived from double transgenic embryos of scl-GFP and gata1-dsRed express both markers at day 2 (A–C) and at day 9 (D–F). Scl-GFP and gata1-dsRed are colocalized in some round-shaped cells (white arrowheads in B and C), and are also exclusively expressed in some cells (GFP, non-round cells, red arrowheads in B; and DsRed, round cells, blue arrowheads in C). Gata1-DsRed-expressing round cells can survive until day 9 and form colony-like structures (white circle in D and red round cells in F) with stronger expression, some of which overlie Scl-GFP-expressing cells (white arrowheads in E and F). (G–N) Cmlc2-GFP transgene marks myocardium at day 2 (G and H) and day 5 (I and J), with some contracting cells. The transgene MLC-GFP shows expression in elongated and flat muscle cells at day 2 (K) and day 3 (L), when culture begins at the dome stage, and at day 4 (M, bright field, and N), starting to culture from shield-stage embryo cells. |
|
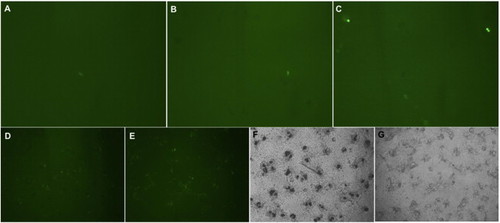
Primary Cultures of Endoderm-Derived Insulin-GFP Pancreatic Beta Cells and Ectoderm-Derived vmat-2 GFP Neurons, Related to Figure 2 (A and B) Insulin-GFP cells are clearly detected at low frequency at day 1 (A) and day 2 (B) after culture. (C–F) Retinoic acid increases the number of insulin-GFP cells by <10-fold (C) compared with control (B). Vmat-2 GFP expression is observed at day 2 of culture (D). bFGF treatment at 100 ng/ml significantly increases GFP-positive cells and causes more neural network/branches (E) compared with control (D). Of interest, bFGF treatment (100 ng/ml) also remarkably inhibits the numbers of pigment cells (G) compared with control (F) at day 3. |
|
Flk1-GFP Endothelial Cells Respond to Inhibitors in Primary Culture, Related to Figure 3 (A–L) SU5416 (5 μM) significantly inhibits endothelial proliferation and differentiation (C, bright field, and D) compared with control (A, bright field, and B) at day 5 of culture. As expected, SU5416 inhibits and bFGF promotes (H and G, bright field; and J and I, bright field) differentiation and proliferation of endothelial cells (E and F controls), respectively, but bFGF does not restore SU5416-induced blockade of endothelial growth (K and L, 50 ng/ml bFGF + 5 μM SU5416), suggesting that VEGF signaling functions independently of the bFGF pathway in endothelial cell proliferation. |
|
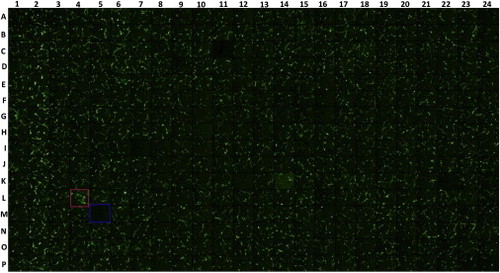
Representative Image of flk1-GFP Endothelial Cells Growing in a 384-Well Plate at Day 5, Related to Figure 4 Column 2 is treated with 2 uM SB431542 as a positive control, and column 23 is treated with 1% DMSO as a negative control. Images of each well were recorded on a LHS-H100P-1 camera (Nikon, Japan) with the ImageXpressMICRO imaging system (Molecular Devices). Imaging DATA was processed with High Content Image Processing software and analyzed in the categories of total tube length, total tube area, and branch points with Angiogenesis Tube Formation (RD-1, MetaXpress, Molecular Devices). Red and blue squares show more and less tube formation, respectively. |
|
Analysis of Akt Phosphorylation and Interaction between Selected Compounds and eNOS Inhibition, Related to Figure 5 (A) Selected small molecules SST and Gh increased phosphorylation levels of Akt in HUVECs after 8 hr of treatment. (B) Inhibition of PI3K by wortmannin reversed enhancement of HUVEC proliferation by selected small molecules. Wortmannin (0.5 μm) was included as a cotreatment with the selected compounds. Compared with the DMSO control, p = 0.0133 for wortmannin, 0.0003 for SST, 0.0045 for Dip, and 0.0018 for Gh. Compared with SST, p = 0.0021 for SST+wortmannin; Dip, p = 0.0036 for Dip+wortmannin; and Gh, p = 0.0045 for Gh+wortmannin. (C) Inhibition of eNOS reversed enhancement of HUVEC proliferation by selected small molecules. L-NAME (Nω-Nitro-L-arginine [Sigma] dissolved in saline), an eNOS inhibitor, attenuated small-molecule-elicited HUVEC proliferation. Compared with control, p = 4.9E-05 for SST, 0.0139 for Dip, 0.0003 for Gh, 0.0003 for Fh. Compared with SST, p = 5.6E-05 for SST+L-NAME; Dip, p = 0.0456 for Dip+L-NAME; Gh, p = 0.0009 for Gh+L-NAME; and Fh, p = 0.0121 for Fh+L-NAME. |


