
- Title
-
Id2a functions to limit Notch pathway activity and thereby influence the transition from proliferation to differentiation of retinoblasts during zebrafish retinogenesis
- Authors
- Uribe, R.A., Kwon, T., Marcotte, E.M., and Gross, J.M.
- Source
- Full text @ Dev. Biol.
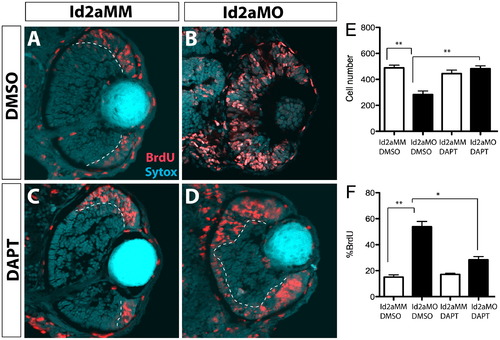
DAPT inhibition of the Notch pathway rescues proliferation defects in Id2a-deficient retinae. (A)–(D) Id2aMM and Id2aMO embryos treated with either (A) and (B) DMSO or (C) and (D) DAPT from 28–48 hpf and pulsed with BrdU for 30 min prior to fixation. Transverse retinal sections showing BrdU-positive cells at 48 hpf (red). Quantification of average cell number per retinal section (E) and the proportion of BrdU-positive cells per retinal section (F) at 48 hpf. Nuclei are stained with Sytox-green (cyan). Dorsal is up in all images. Error bars represent SEM, n=9; *p<0.05, **p<0.005. PHENOTYPE:
|
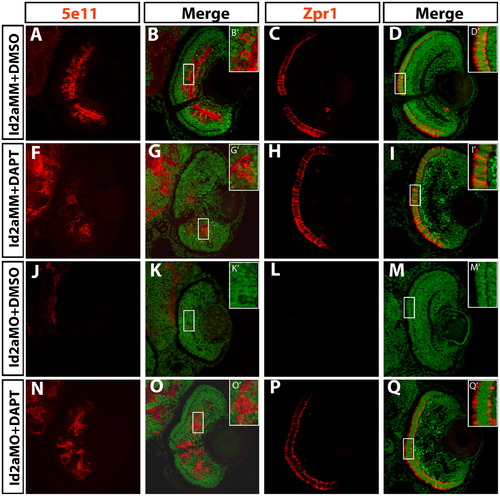
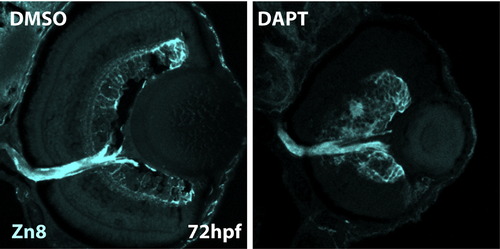
DAPT inhibition of the Notch pathway rescues terminal differentiation in Id2a-deficient retinae. Transverse retinal sections at 72 hpf from Id2aMM-DMSO (A)–(D), Id2aMM-DAPT (F)–(I), Id2aMO-DMSO (J)–(M) and Id2aMO-DAPT (N)–(Q) embryos. Embryos were treated with DMSO or DAPT from 28–72 hpf. Amacrine cells marked by 5e11 (A), (F), (J) and (N) and red/green cones marked by Zpr1 (C), (H), (L) and (P) fail to differentiate in Id2aMO retinas treated with DMSO (J), while in Id2aMO retinas treated with DAPT, both amacrine cells and red/green cones are detected (N) and (P). Merged images show co-staining of retinal marker (red) and nuclei (Sytox-green; green). Dorsal is up in all images. EXPRESSION / LABELING:
PHENOTYPE:
|
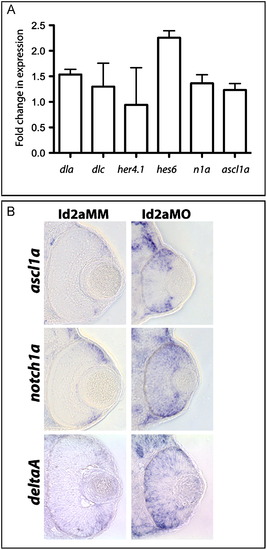
Notch pathway component gene expression is upregulated in Id2a-deficient retinae. (A) qRT-PCR quantification of 48 hpf dla, dlc, her4.1, hes6, n1a and ascl1a levels in Id2aMO and Id2aMM retinae. Transcript levels were normalized to tubulin, alpha 1 and the fold-change in expression in Id2aMO vs. Id2aMM presented. Error bars represent SEM, **p<0.05, n=3 biological replicates. (B) Transverse sections reveal the expression domains for ascl1a, notch1a and deltaA in Id2aMM and Id2aMO embryos at 48 hpf following in situ hybridization (n=6 sectioned embryos/condition). |
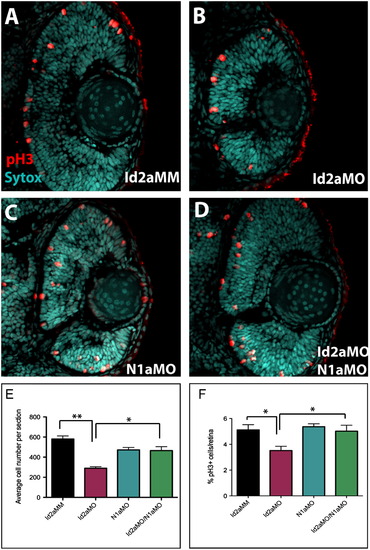
Knockdown of Notch1a rescues retinoblast proliferation defects in Id2a-deficient retinae. (A)–(D) pH3 immunohistochemistry was used to quantify retinoblasts in late G2/M in transverse retinal sections from (A) Id2aMM, (B) Id2aMO, (C) N1aMO and (D) Id2aMO/N1aMO embryos at 48 hpf. Average total cell number per retinal section was determined for each condition (E), as well as the average percentage of pH3-positive cells per retinal section (F). Dorsal is up in all images. Error bars represent SEM, n=9; *p<0.05, ** p<0.005. PHENOTYPE:
|
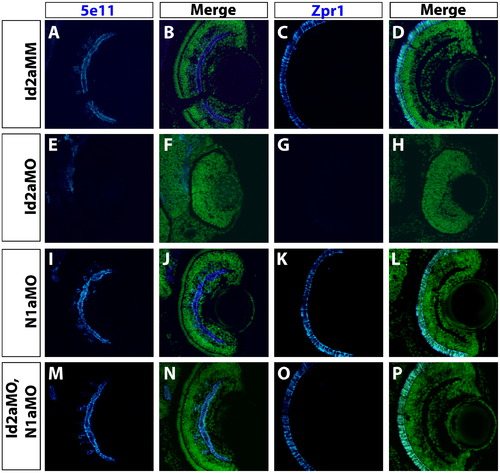
Knockdown of Notch1a rescues terminal differentiation of retinal neurons in Id2a-deficient retinae. Transverse retinal sections from Id2aMM (A)–(D), Id2aMO (E)–(H), N1aMO (I)–(L) and (M)–(P) Id2aMO/N1aMO embryos at 72 hpf assayed for 5e11 expression (amacrine cells) or Zpr1 expression (red/green cones). Merged images show co-staining of retinal marker (blue) and nuclei (Sytox-green; green). Dorsal is up in all panels. PHENOTYPE:
|

Id2a-overexpression is sufficient to limit the retinal expression of Notch pathway component genes. Transverse sections reveal the expression domains for n1a, ascl1a, dla and her4.1 at 33hpf in gfp-injected control (A)–(D) and id2a-overexpressing (E)–(H) embryos following in situ hybridization (n=6 sectioned embryos/condition). (I) qRT-PCR quantification of ascl1a, n1a, dla and her4.1 levels in id2a retinas compared to gfp control retinas at 33 hpf. Transcript levels were normalized to tubulin, alpha 1 and the fold-change in expression in gfp-injected vs. id2a-injected retinae presented. Error bars represent SEM, **p <.05, n=3 biological replicates. |
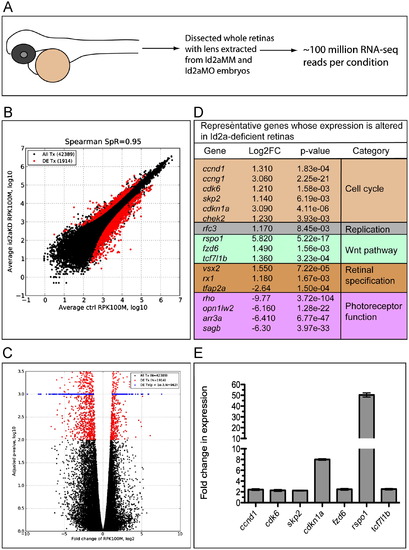
RNA-Seq analysis of differential retinal gene expression resulting from Id2a-deficiency. (A) Schematic of RNA-Seq experiment. Whole retinas were dissected from Id2aMM and Id2aMO embryos, their lenses were removed and total retinal RNA was extracted and used for Illumina RNA sequencing. ∼100 million Illumina reads were obtained for each condition, and the experiment was repeated in two biological replicates for each condition (see the Materials and methods section for details). (B) The number of reads per each transcript was normalized with total number of mapped reads and transcript length, converting all raw read counts to ‘number of reads per 1000 bases per 100 million reads’ (RPK100M). ‘100 million reads’ were chosen to get positive values of log10-transformed normalized values. A scatter plot shows the correlation between Id2aMO and Id2aMM control normalized reads (Spearman=0.95). Differentially expressed transcripts with fold changes greater than 2 and adjusted p-value less than 0.01 are indicated with red dots. (C) Volcano plot illustrating that out of 42,389 mapped transcripts, 1914 were significantly differentially expressed (DE), p<0.01 (red dots), and, for visualization purposes, of those 962 were highly significant, with an adjusted p-value <0.001 (blue dots). (D) A table depicting representative genes that exhibit significant changes in gene expression between Id2aMM and Id2aMO retinas; genes were categorized based upon known pathways and are color coded. (E) qRT-PCR validation of RNA-Seq data for a subset of DE genes. Transcript levels of ccnd1, cdk6, skp2, cdkn1a, fzd6, rspo1 and tcf7l1b in Id2aMO retinae compared to Id2aMM retinae at 48hpf. Transcript levels were normalized to tubulin and the fold-change in expression in Id2aMO retinae compared to Id2aMM retinae presented. Error bars represent SEM, **p<0.05, n=3 biological replicates. |
|

|
Reprinted from Developmental Biology, 371(2), Uribe, R.A., Kwon, T., Marcotte, E.M., and Gross, J.M., Id2a functions to limit Notch pathway activity and thereby influence the transition from proliferation to differentiation of retinoblasts during zebrafish retinogenesis, 280-292, Copyright (2012) with permission from Elsevier. Full text @ Dev. Biol.