
- Title
-
S1P1 inhibits sprouting angiogenesis during vascular development
- Authors
- Ben Shoham, A., Malkinson, G., Krief, S., Shwartz, Y., Ely, Y., Ferrara, N., Yaniv, K., and Zelzer, E.
- Source
- Full text @ Development
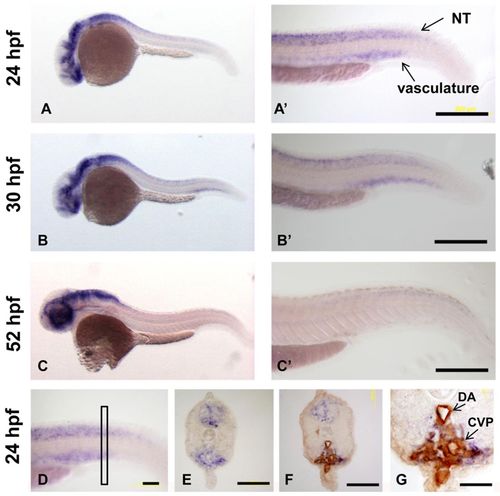
Expression profile of s1p1 during zebrafish embryonic development. (A-G) In situ hybridization for s1p1 in zebrafish embryos at 24 hpf (A,A2), 30 hpf (B,B2) and 52 hpf (C,C2). A2, B2 and C2 show magnifications of the tail area shown in A, B and C, respectively. NT, neural tube. (D) Lateral view of the tail at 24 hpf. (E) Cross-section from the rectangular area marked in D. (F) Cross-section of Tg(fli-egfp)y1 zebrafish embryo counter-immunostained with anti-GFP antibody to mark blood vessels. (G) Magnification of F; both the dorsal aorta (DA) and the caudal vein plexus (CVP) show s1p1 expression. Scale bars: in A-C2, 200 μm; in D-F, 50 μm; in G, 20 μm. |

s1p1 knockdown in zebrafish causes defects in blood vessel formation. Tg(fli-egfp)y1 zebrafish embryos were injected with a control MO and a translation-blocking s1p1 MO and analyzed at 3 dpf. (A,B) Bright-field images of control and s1p1 MO embryos. Arrows in B indicate hindbrain malformations, pericardial edema and heart defects observed in the mutant. (C) Fluorescence microscopy of control and s1p1 MO embryos at 24 hpf. Right-hand panel shows magnifications of the boxed areas on the left. (D) Measurements of ISV length (corresponding to the boxed area in C) in control and s1p1 MO embryos (n=8 WT and 8 MO embryos, P<0.0001, error bars represent s.e.m.). (E) Quantification of ISV location relative to the midline (n=10 WT and 10 MO embryos; 6-8 ISVs from each embryo were analyzed, P<0.05, error bars represent s.e.m.). Scale bars: in C, left panel, 200 μm; in C, right panel, 100 μm. PHENOTYPE:
|

s1p1 MO embryos exhibit remodeling defects in the ISV and CVP. (A) Schematic showing the anatomical location of the areas shown in B and C. (B,C) Fluorescence microscopy of the ISV (B) and CVP (C) regions in WT and s1p1 MO Tg(fli-egfp)y1 zebrafish embryos at 24 and 48 hpf. (B2) Graph showing comparable filopodia numbers in ISV of WT and s1p1 MO zebrafish (nwt=11, ns1p1MO=16, P=0.92). (C2) Graph showing comparison of the intercapillary area in the CVP between WT and s1p1 MO zebrafish (nwt=7, ns1p1 MO=7, P=0.002, error bars represent s.e.m.). Scale bars: in B, 10 μm; in C, 20 μm. PHENOTYPE:
|
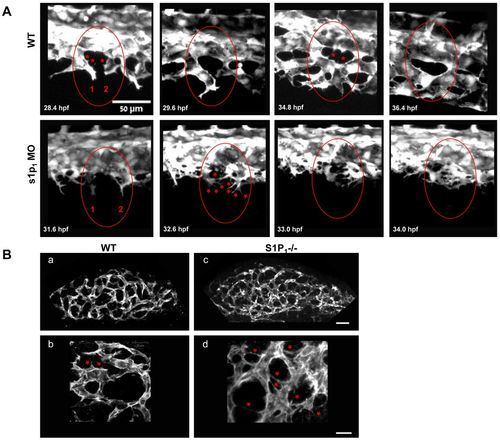
Excessive filopodia formation leads to aberrant vascular remodeling in s1p1 MO zebrafish and S1P1-/- mouse embryos. (A) Sequential confocal microscopy images showing lateral views of the CVPs from WT and s1p1 MO Tg(fli-egfp)y1 zebrafish embryos. Circles demarcate two sprouts, marked as 1 and 2, in WT and s1p1 MO embryos that extend filopodia (marked with asterisks). This results in the formation of a capillary loop in the WT and in over-sprouting and fusion in the mutant. For visualization of the entire sequence, see supplementary material Movies 1 and 2. (B) Immunofluorescent staining with anti-CD31 of whole-mount forelimbs from E9.5 WT (a,b) and S1P1-/- (c,d) mice; b and d show magnifications of a and c, respectively. Asterisks indicate excessive filopodia in S1P1-/- limbs, compared with WT limbs. Scale bars: in a,c, 50 μm; in b,d, 20 μm. PHENOTYPE:
|
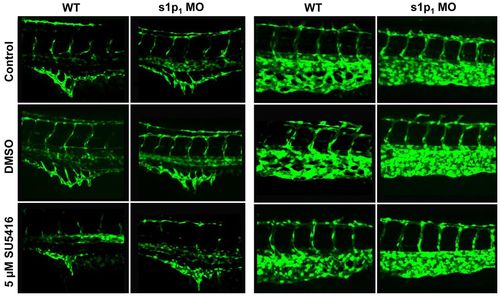
Both Vegfa-dependent and -independent effects of S1p1 on vascular development in zebrafish. Fluorescence microscopy of 48 hpf control and s1p1 MO zebrafish embryos. Left panel: SIV of untreated (control), DMSO-treated and 5 μM SU5416-treated embryos; right panel: CVP of untreated (control), DMSO-treated and 5 μM-SU5416 treated embryos. PHENOTYPE:
|
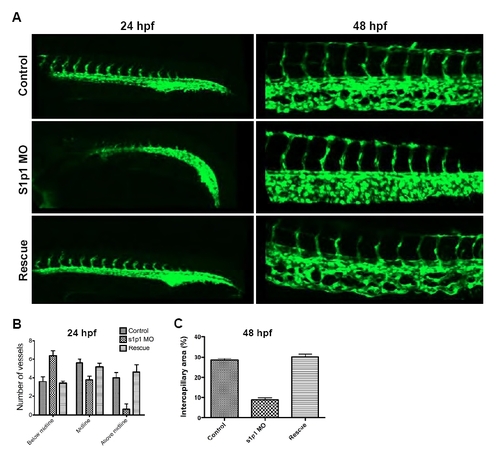
Rescue of the vascular phenotype by s1p1 mRNA injection. (A) Fluorescence microscope images of control (upper panel), s1p1 MO (middle) and s1p1 mRNA-injected morphant (lower panel) zebrafish embryos at 24 (left) and 48 hpf (right). (B) Quantification of ISV location relative to the midline. Both mRNA-injected (rescue experiment) and non-injected s1p1 MO zebrafish were compared with control embryos (n=6 WT, 6 MO and 6 mRNA-injected embryos, 6-8 ISVs from each embryo were analyzed; s1p1 MO: P<0.05; rescue experiment: Pbelow midline -0.74, Pabove midline=0.74; error bars represent s.e.m.) (C) Comparison of the intercapillary area in the CVP between WT, slp1MO and mRNA-injected zebrafish (n=6 in all groups; Ps1p1 MO=0.002, PRescue=0.39, error bars represent s.e.m.). |
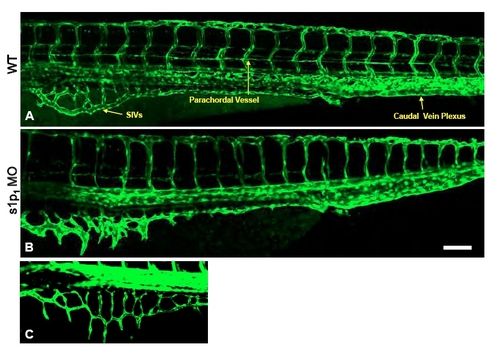
S1p1 knockdown in zebrafish causes defects in blood vessel formation. (A-C) Fluorescence microscopy of control (A) and slp1 MO (B,C) embryos at 3 dpf. Arrows indicate subintestinal vessel (SIV), parachordal vein and caudal vein plexus. SIVs in the slp1 MO embryo exhibit two phenotypes, namely dilated vessels (B) and ectopic sprouting (C). Scale bar: 100 μm. PHENOTYPE:
|