
- Title
-
Dynamics of degeneration and regeneration in developing zebrafish peripheral axons reveals a requirement for extrinsic cell types
- Authors
- Villegas, R., Martin, S.M., O'Donnell, K., Carrillo, S., Sagasti, A., and Allende, M.L.
- Source
- Full text @ Neural Dev.

Acute axonal degeneration (AAD) and Wallerian degeneration are observed in the zebrafish posterior lateral line (pLL) nerve after laser axotomy. A three dpf larva, injected with HuC::GFP to image and axotomize a single pLL neuron. (a) Intact neuron with a typical bipolar morphology. White arrowhead shows central projection, yellow arrowhead shows peripheral projection, and square shows cell body. (b) Zero hours postaxotomy (hpa), arrowhead points to position of laser axotomy. (c) Thirty minutes after axotomy. AAD was complete: arrowheads indicate extent of AAD. (d) Three hours after axotomy, the distal axon began to fragment (arrowheads). (e) Four hours after axotomy, some fragments remained. (f) Five hours postaxotomy, clearance of debris was almost complete. Scale bar, 100 μm. |

Leukocyte migration to degenerating axons is enhanced in the absence of glia. (a) Leukocytes (yellow arrowheads) homed to the degenerating pLL nerve in a lysC::GFP/neuroD::GFP double transgenic larva. (b) The number of leukocytes directly in contact with degenerating axons was significantly increased in the absence of glia (AG1478). Quantitative analysis was performed between 2.5 and 4.5 hours postaxotomy. Student′s t test, P = 0.00167. |

Hair cells remain viable during Wallerian degeneration. Top panel: A single neuromast of a three dpf double transgenic neuroD::GFP/brn3c::GFP larva expressing GFP in axons and hair cells was imaged for the first 10 hours after axotomy. At six hours postaxotomy, the nerve had degenerated and one hair cell had died (red arrowhead). Lower panel: total number of hair cells in the first neuromast at three and six hours postaxotomy (hpa); pLL degeneration did not significantly alter hair cell numbers. *Two-way ANOVA, P >0.05. Scale bar 50 μm. |
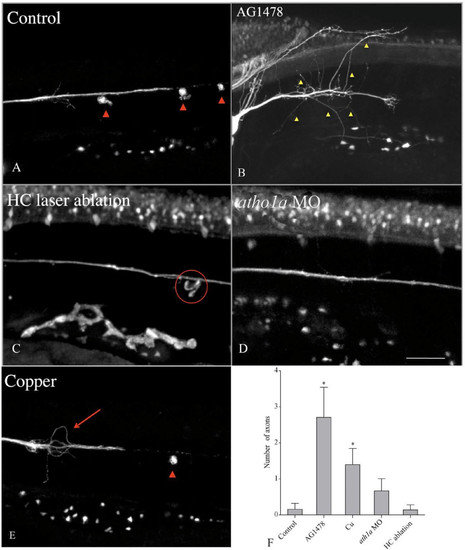
Posterior lateral line (pLL) axon degeneration is affected by the absence of Schwann cells or hair cells. Double transgenic larvae (brn3c::GFP/neuroD::GFP) were treated to remove Schwann cells (AG1478) or hair cells (laser ablation) prior to axotomy, and were examined after 24 hours to evaluate regeneration of the pLL nerve. (a) Control fish; red arrowheads indicate neuromasts; the nerve grew along its original path. (b) When Schwann cells were absent, axons regenerated after axotomy but many of them failed to grow along the normal trajectory (yellow arrowheads). (c) After physical ablation of hair cells in lateral line neuromasts (circle indicates position of ablated neuromast), axon regeneration was normal. (d) Axon regeneration was normal after inhibition of hair cell differentiation with the ath1a morpholino. (e) Ablation of neuromasts with CuSO4 treatment produced erratic growth of regenerating axons (arrow), but the normal trajectory of neurites was restored when neuromast hair cells (arrowhead) regenerated. (f) The number of axons wandering outside of the normal pLL trajectory was quantified and compared across the different conditions as indicated. *Significant differences between treatments (one-way nonparametric ANOVA, P <0.05). |

Posterior lateral line axons regenerate after laser axotomy. Representative images of the trunk of a three dpf brn3c::GFP/neuroD::GFP double transgenic larva imaged at the specified times (hours postaxotomy, hpa) near the lesion site. White arrow shows the leading axon tip. Scale bar, 100 μm. |

Fragmentation proceeds in a distal-to-proximal direction. Single axons of fish injected with HuC::GFP were transected at 72 hpf, and imaged every 2 minutes both adjacent to the axotomy site (proximal) and further down the length of the embryo (distal). A and B are images from two representative fish mounted laterally, with their left side visible. Fragmentation was observed (red arrows) in the distal segment earlier than in the proximal segment. Beading (white arrows), which precedes fragmentation, was also seen first in the distal segment. The length of time between the onset of fragmentation in distal and proximal segments is variable. Times shown are relative to the first image in each set. Scale bar, 100 μm. |
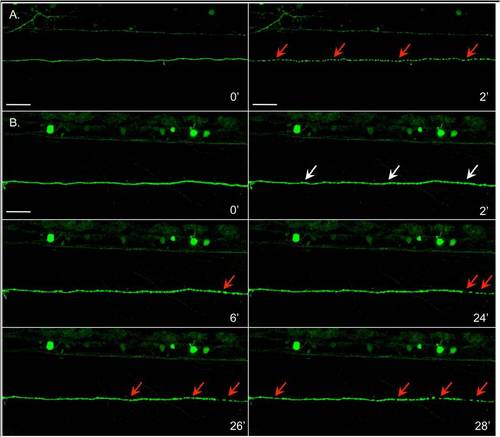
Within an axon segment, synchronicity of degeneration is variable.A. Fragmentation was synchronous within the span of axon segment shown. The axon segment was continuous at time 0 (left), and two minutes later was completely fragmented (right, arrows). Times are relative to the first image in each set. Fish is the same as that shown in Additional File 3A, distal. B. The axon segment shown underwent synchronous beading (white arrows, t = 2′), but fragmentation (red arrows) began at the distal end (t = 6′). Approximately 20 minutes elapsed before the fragmentation advanced towards the proximal end (left in these images), but progression of fragmentation along the remaining segment was rapid. In all images, right is more distal to the site of transection than left. Fish is the same as in Additional File 3B (distal). Scale bar, 50 μm. |