- Title
-
Overexpression of akt1 enhances adipogenesis and leads to lipoma formation in zebrafish
- Authors
- Chu, C.Y., Chen, C.F., Rajendran, R.S., Shen, C.N., Chen, T.H., Yen, C.C., Chuang, C.K., Lin, D.S., and Hsiao, C.D.
- Source
- Full text @ PLoS One
|
Generation of Tg(krt4:Hsa.myrAkt1)cy18. (A) The schematic diagram in the upper panel shows the configuration of the pDestTol2CG2-krt4-myrAkt1-IRES-EGFP-pA plasmid used to generate Tg(krt4:Hsa.myrAkt1)cy18. The parental vector of pDestTol2CG2, which contains cmlc2-EGFP-pA mini-gene, helps transgenic progeny to express green fluorescent protein in the heart. The lower panel illustrates the domain structure of the wild-type and constitutively active form of human Akt1. (B) Western blot analysis of protein lysate extracted from adult tail fins shows that the exogenous human myrAkt1 (indicated by star) is only detectable in Tg(krt4:Hsa.myrAkt1)cy18. β-actin served as a loading control. Whole-mount immunostaining of wild-type (C) or Tg(krt4:Hsa.myrAkt1)cy18(E) embryos aged 3 days post-fertilization using pan-Akt antibody. The yolk sac region highlighted by a dotted line in C and E is magnified in E and F, respectively. PH, Pleckstrin homology; RD, regulation domain; Myr, myristylation signal; WT, wild type; Tg, Tg(krt4:Hsa.myrAkt1)cy18. Scale bar = 100 μm. EXPRESSION / LABELING:
|
|
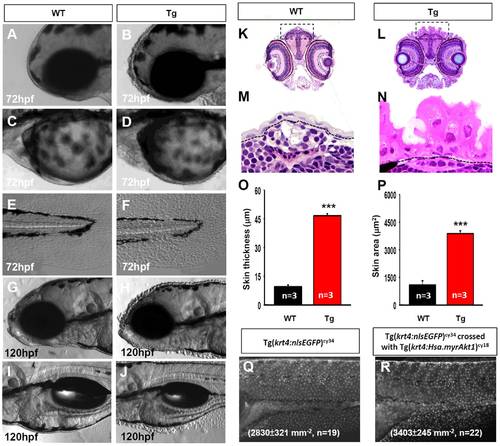
Tg(krt4:Hsa.myrAkt1)cy18 fish display skin hypertrophy and hyperplasia at the embryonic stage. Microscopic pictures of skin epidermis near the head regions (A, B), pericardial cavity and yolk sac (C, D), and tail fin (E, F) of either WT (A, C, E) or Tg(krt4:Hsa.myrAkt1)cy18 (B, D, F) at 72 hpf. At 120 hpf, the protruding appearance of skin covering the head (H) and yolk sac (J) was more pronounced in Tg than their wild-type siblings (G, I). Skin histology of WT (K, M) and Tg(L, N) embryos at 120 hpf. Cross sections through the eye position are stained with hematoxylin and eosin. The areas highlighted by a dotted line in K and L are magnified in M and N, respectively. Quantitative comparison of skin thickness (O) and area (P) between WT (black bar) and Tg (red bar). (Q, R) Quantitative comparison of skin density between Tg(krt4:nlsEGFP)cy34 and double transgenics of Tg(krt4:nlsEGFP)cy34;Tg(krt4:Hsa.myrAkt1)cy18 at 120 hpf. ***p<0.001. Data were analyzed by Student’s t-test and are shown as mean ±SEM. hpf, hour post-fertilization; WT, wild type; Tg, Tg(krt4:Hsa.myrAkt1)cy18. PHENOTYPE:
|
|
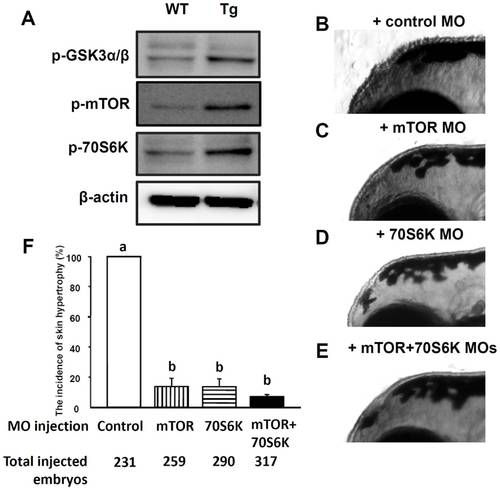
The Akt downstream genes are activated in Tg(krt4:Hsa.myrAkt1)cy18. (A) Western blot analysis of protein lysate extracted from adult tail fins showing that many downstream targets of Akt1 are over-phosphorylated in Tg. β-actin served as a loading control. (B-E) MO knock-down experiment to evaluate whether the skin hypertrophy phenotype can be rescued when Akt activity ceases. Fertilized eggs collected from Tg outcross were injected with either control MO (B), mTOR MO (C), 70S6K MO (D), or mTOR+70S6K MOs (E). The skin hypertrophic appearance was scored at 120 hpf and compared quantitatively (F). MO, morpholino; WT, wild type; Tg, Tg(krt4:Hsa.myrAkt1)cy18; Different letters above the error bars indicate significant differences which tested by one-way ANOVA with Tukey’s pair-wise comparison method. hpf, hour post-fertilization. |
|
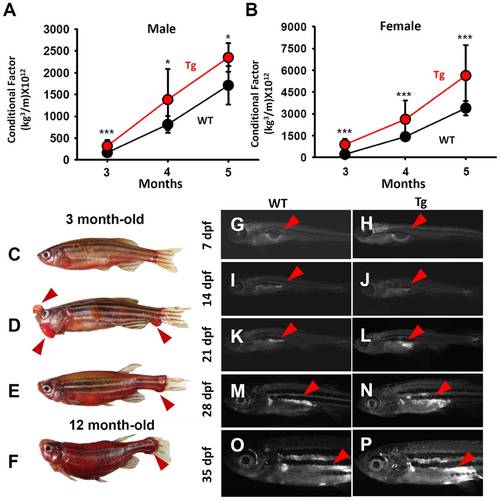
Tg(krt4:Hsa.myrAkt1)cy18 fish display obese phenotype at the adult stage. Comparison of the conditional factor between WT (black) and Tg (red) for either male (A) or female (B) fish aged from 3- to 5-month old. Error bars labeled with stars indicate significant differences as tested by Student’s t-test. Oil Red O stains of fish from either wild-type (C), F0 founder carrying krt4:myrAkt1transgene (D), F1 Tg aged at 3 mpf (E), and F1 Tg aged at 12 mpf (F). Nile red vital staining reveals the lipid accumulation in WT and Tg aged at 7 dpf (G and H), 14 dpf (I and J), 21 dpf (K and L), 28 dpf (M and N) and 35 dpf (O and P). Arrows indicate nile red-positive lipids.WT, wild type; Tg, Tg(krt4:Hsa.myrAkt1)cy18; dpf, day post-fertilization; mpf, month post-fertilization. |
|
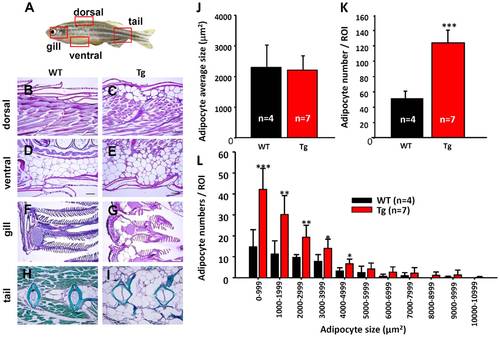
Histology of the obese transformed Tg (krt4:Hsa.myrAkt1)cy18. (A) Schematic diagram showing the relative positions (red dotted boxes) for histological sections from B to I. Histological assessment of dorsal muscle tissues (B and C), visceral adipocytes (D and E), gill arch (F and G) and bone tissues in the tail (H and I) for WT and Tg aged 3 mpf. The paraffin sections in B to G were stained with Periodic acid-Schiff, and bone tissues in the tail regions (H&I) were stained with Masson’s trichrome. Comparison adipocyte average size (J), adipocyte numbers (K), and adipocyte size distribution histogram (L) between WT and Tg. Stars above the error bars indicate significant differences as tested by Student’s t-test (*p<0.05, **p<0.01, and ***p<0.001). WT, wild type; Tg, Tg(krt4:Hsa.myrAkt1)cy18; mpf, month post-fertilization. |
|
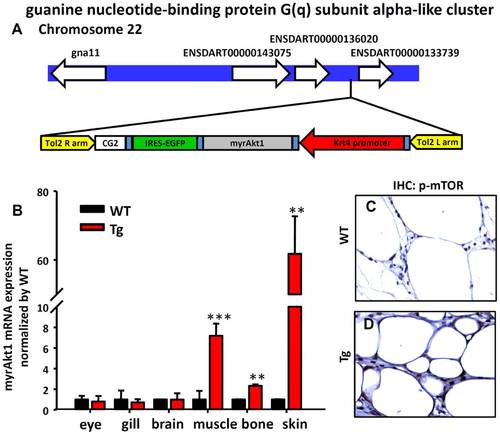
Detection of the ectopic expression of myrAkt1 transgene in Tg(krt4:Hsa.myrAkt1)cy18. (A) Schematic diagram showing the chromosomal integration site in Tg. (B) Relative expression level of myrAkt1 transgene among different tissues assayed by real-time RT-PCR. Stars above the error bars indicate significant differences as tested by Student’s t-test (**p<0.01, and ***p<0.001). The detection of the expression of a Akt downstream target of phospho-mTOR in the adipose tissues of WT (C) and Tg (D) by immunohistochemistry. WT, wild type; Tg, Tg (krt4:Hsa.myrAkt1)cy18. EXPRESSION / LABELING:
|
|
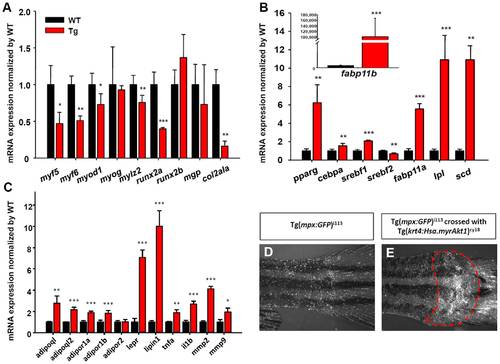
Deregulation of myogenesis-, skeletogenesis-, adipogenesis-, adipocytokine- and inflammation-related genes in Tg(krt4:Hsa.myrAkt1)cy18. Comparison of relative expression level of myogenesis/skeletogenesis- (A), adipogenesis- (B), adipocytokine and inflammatory-related (C) gene transcripts between WT and Tg assayed by real-time RT-PCR. Stars labeled above the error bars indicate significant differences as tested by Student’s t-test.*p<0.05, **p<0.01, and ***p<0.001.Visualization of the inflammatory response (red dotted line) in the tail region of both Tg(mpx:GFP)i113 (D) and double transgenic progeny derived from Tg(mpx:GFP)i113 and Tg(krt4:Hsa.myrAkt1)cy18 crossing (E).WT, wild type; Tg, Tg(krt4:Hsa.myrAkt1)cy18. |

ZFIN is incorporating published figure images and captions as part of an ongoing project. Figures from some publications have not yet been curated, or are not available for display because of copyright restrictions. PHENOTYPE:
|

Unillustrated author statements PHENOTYPE:
|


