
- Title
-
Adenosine Signaling Promotes Regeneration of Pancreatic beta Cells In Vivo
- Authors
- Andersson, O., Adams, B.A., Yoo, D., Ellis, G.C., Gut, P., Anderson, R.M., German, M.S., and Stainier, D.Y.
- Source
- Full text @ Cell Metab.
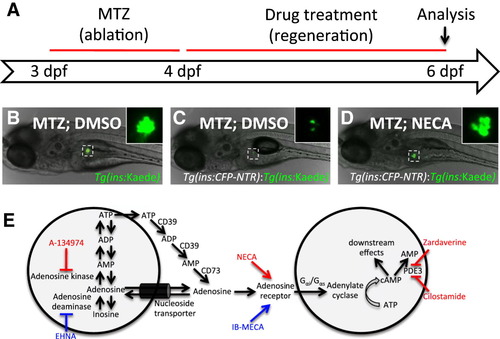
A Chemical Screen for β Cell Regeneration (A) Schema for the β cell regeneration screen. The pancreatic β cells are conditionally targeted for ablation from 3-4 dpf by using β cell-specific expression of nitroreductase (Tg[ins:CFP-NTR]), which converts metronidazole (MTZ) into a cytotoxic product. After washing away the MTZ, the larvae are placed in 96-well plates and exposed to 2–50 μM of the compounds in 1% DMSO. After 2 days of recovery, from 4-6 dpf, β cell regeneration can be easily quantified in double-transgenic larvae, Tg(ins:CFP-NTR);Tg(ins:Kaede), because Kaede labels the β cells with bright fluorescence. (B) Picture of a control Tg(ins:Kaede) larva at 6 dpf that was not affected by the MTZ treatment (because it does not express NTR) and therefore displays a typical number of β cells, as visualized with the microscope used for screening. The inset displays a magnified view of the pancreatic islet (outlined by the dashed square). (C) Tg(ins:CFP-NTR);Tg(ins:Kaede) larva (6 dpf) following β cell ablation with MTZ from 3-4 dpf and vehicle treatment from 4-6 dpf. Typically, these control larvae have three to seven β cells at this stage. (D) Tg(ins:CFP-NTR);Tg(ins:Kaede) larva following β cell ablation with MTZ from 3-4 dpf and treatment with the hit compound NECA from 4-6 dpf. This particular larva contains too many β cells to count without the use of confocal microscopy. (E) The hit compounds converge on adenosine signaling/metabolism by targeting adenosine kinase (A-134974), adenosine receptors (NECA), and phosphodiesterase 3/4 (Cilostamide and Zardaverine). Compounds that increased β cell regeneration more than 2-fold after 2 days of treatment are labeled in red. After rescreening all activators of adenosine signaling contained in the Sigma LOPAC library, we found that an adenosine deaminase inhibitor (EHNA) and another nonselective adenosine agonist (IB-MECA) (labeled in blue) could also increase β cell regeneration, although less than 2-fold. See also Figure S1. |

The Hit Compounds Increase Regeneration, Not Survival, of β Cells (A) Schematic diagram for cell labeling and assessment of β cell survival/regeneration. To examine β cell survival, we made use of the photoconvertible property of the fluorescent protein Kaede. At 3 dpf, before ablating the β cells with MTZ from 3-4 dpf, we converted Tg(ins:Kaede)-expressing β cells from green to red by exposing them to UV light. After 2 days of regeneration (6 dpf), the surviving β cells are red and green (yellow overlap), whereas the newly formed β cells are green only. (B and C) Confocal images of DMSO- and NECA-treated larvae with Tg(ins:Kaede)-expressing β cells at 6 dpf. Note that there is one β cell that survived the ablation in this particular DMSO-treated larva (arrow in B), whereas there are no β cells that survived the ablation in this NECA-treated larva (C). (D) Quantification of β cell regeneration (green bars) and β cell survival (yellow bars) per larva at 6 dpf, following treatment with DMSO, NECA, Cilostamide, or A-134974 from 4-6 dpf. p < 0.0001; n = 10 larvae for each group. Error bars represent SEM. See also Figure S2. |

NECA Has a Modest Effect on Normal β Cell Development but Strongly Accelerates β Cell Regeneration (A–D) Tg(ins:GFP);Tg(ins:CFP-NTR) larvae were treated with MTZ from 3-4 dpf to ablate the β cells and subsequently treated with DMSO/NECA and EdU during regeneration from 4-6 dpf. EdU was developed in red, and nuclei were counterstained with topro (in blue). (A) Confocal image of a 6 dpf DMSO-treated larva displaying one β cell that had incorporated EdU (arrow) during regeneration from 4-6 dpf. (B) Confocal image of a 6 dpf NECA-treated larva displaying ten β cells that had incorporated EdU (arrows) during regeneration from 4-6 dpf. (C) Quantification of the total number of β cells (green bars) and β cells that had incorporated EdU (white bars) per larva during DMSO or NECA treatment from 4-6 dpf during β cell regeneration. (D) Rate of EdU incorporation, displayed as the percentage of β cells that incorporated EdU. n = 18 larvae for each group. (E–H) Tg(ins:GFP) larvae were treated with DMSO/NECA and EdU from 4-6 dpf to assess EdU incorporation in β cells during normal development. EdU was developed in red, and nuclei were counterstained with topro (in blue). (E) Confocal image of a 6 dpf DMSO-treated larva showing no EdU incorporation in its β cells between 4 and 6 dpf of normal development. (F) Confocal image of a 6 dpf NECA-treated larva displaying one β cell that had incorporated EdU between 4 and 6 dpf of normal development. (G) Quantification of the total number of β cells (green bars) and β cells that had incorporated EdU (white bars) per larva during DMSO or NECA treatment from 4-6 dpf of normal development. (H) Rate of EdU incorporation, displayed as the percentage of β cells that incorporated EdU. n = 25 larvae for DMSO treated, and n = 32 larvae for NECA treated. (I and J) During normal development of the dorsal pancreatic bud, Tg(ins:GFP) embryos were treated with DMSO or NECA from 6-18 hpf. Nuclei were counterstained with topro (blue). (I) Confocal projection of a DMSO-treated Tg(ins:GFP) embryo at 18 hpf. (J) Confocal projection of a NECA-treated Tg(ins:GFP) embryo at 18 hpf. We observed no significant difference in the number of β cells. (K) Free glucose levels during β cell regeneration in the presence of DMSO or NECA. After being treated with MTZ from 3-4 dpf, the larvae either had an islet depleted of β cells owing to the expression of Tg(ins:CFP-NTR) (NTR), or a normal islet because they were wild-type (WT). The larvae were subsequently treated with DMSO or NECA from 4-7 dpf. Free glucose levels were significantly lower in NTR larvae treated with NECA (green line) than in NTR larvae treated with DMSO (yellow line), after treatment for 2 days (from 1,164 to 820 pmol/larva, p = 0.0031) and 3 days (from 681 to 498 pmol/larva, p = 0.0292) days. n = 40 larvae (four pools of ten larvae) per data point. Error bars represent SEM. See also Figure S3. EXPRESSION / LABELING:
PHENOTYPE:
|
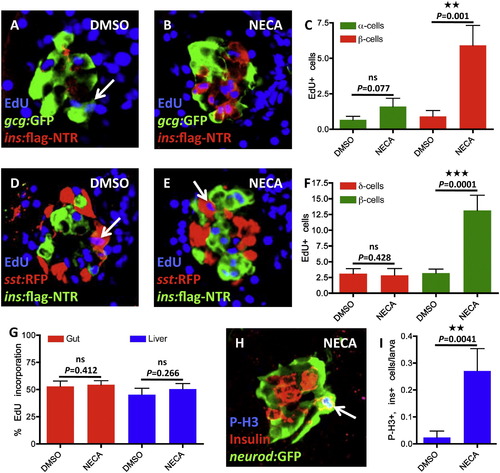
NECA Enhances Proliferation of β Cells, and Not Cell Proliferation in General (A–C) Proliferation of α cells was assessed by EdU incorporation in Tg(gcg:GFP)-expressing α cells. Tg(gcg:GFP);Tg(ins:flag-NTR) larvae were treated with MTZ from 3-4 dpf for ablation of the β cells and subsequently treated with DMSO/NECA and EdU during β cell regeneration from 4-6 dpf. (A) Confocal image of a DMSO-treated larva displaying one α cell that had incorporated EdU (arrow). (B) Confocal image of a NECA-treated larva that does not show any EdU incorporation in α cells, but substantial EdU incorporation in β cells (positive for Tg(ins:flag-NTR) expression). (C) Quantification of EdU incorporation in α cells (green bars) and β cells (red bars) in the presence of DMSO or NECA. Note that the number of α cells that incorporated EdU during treatment with NECA did not significantly increase, although incorporation of EdU in Tg(ins:flag-NTR)-expressing β cells increased markedly in the same larvae. n = 11 larvae for each group. (D–F) Proliferation of δ cells was assessed by EdU incorporation in Tg(sst:RFP)-expressing δ cells. Tg(sst:RFP);Tg(ins:flag-NTR) larvae were treated with MTZ from 3-4 dpf for ablation of the β cells and subsequently treated with DMSO/NECA and EdU during β cell regeneration from 4-6 dpf. (D) Confocal image of a DMSO-treated larva displaying one δ cell that had incorporated EdU (arrow). (E) Confocal image of a NECA-treated larva displaying one δ cell that had incorporated EdU, and substantial EdU incorporation in β cells (positive for Tg(ins:flag-NTR) expression). (F) Quantification of EdU incorporation in δ cells (red bars) and β cells (green bars) in the presence of DMSO or NECA. n = 10 larvae for each group. (G) Quantification of proliferation in the gut and liver in Tg(ins:CFP-NTR) larvae following β cell ablation from 3-4 dpf and subsequent treatment with DMSO/NECA from 4-6 dpf. The percentage of cells that incorporated EdU between 4-6 dpf during β cell regeneration did not change with NECA treatment when compared to DMSO-treated controls. n = 10 larvae for each group. (H) The mitosis marker Phospho-Histone H3 (P-H3) colabels a β cell that expresses both insulin and Tg(neurod:GFP) (arrow) following β cell ablation from 3-4 dpf and subsequent treatment with NECA from 4-6 dpf. Note that the β cell that is positive for P-H3 is located in the periphery of the islet. (I) Quantification of β cell proliferation, as marked by colocalization of insulin and P-H3, following β cell ablation from 3-4 dpf and subsequent treatment with DMSO/NECA from 4-6 dpf. n = 42 larvae for DMSO treated; n = 48 larvae for NECA treated. Error bars represent SEM. See also Figures S4 and S5. |
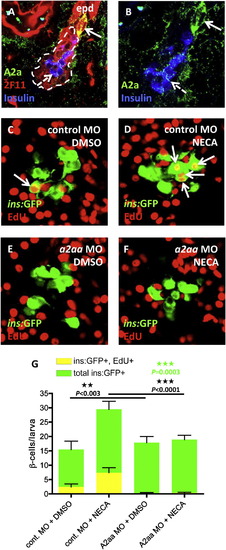
The Adenosine Receptor A2aa Mediates the Regenerative Effect of NECA (A) Confocal image of the expression of the A2a adenosine receptors in a 5 dpf larva. The 2F11 antibody marks the extrapancreatic duct (epd) as well as the endocrine islet (outlined by the dashed line). High expression of A2a is found in cells budding off the epd (arrow), and low expression is found in insulin-expressing β cells (dashed arrow) and cells scattered throughout the exocrine pancreas. (B) For clarity, a magnified view of (A), without the red color, is displayed. (C–G) Tg(ins:GFP);Tg(ins:CFP-NTR) embryos were injected with a control MO or an a2aa MO at the one-cell stage and subsequently treated with MTZ from 3-4 dpf to ablate the β cells, and DMSO/NECA and EdU during β cell regeneration from 4-6 dpf. (C) Confocal image of a DMSO-treated control MO-injected larva displaying one β cell that had incorporated EdU (arrow). (D) Confocal image of a NECA-treated control MO-injected larva displaying four β cells that had incorporated EdU (arrows). (E) Confocal image of a DMSO-treated a2aa MO-injected larva where no β cells had incorporated EdU. (F) Confocal image of a NECA-treated a2aa MO-injected larva where no β cells had incorporated EdU. (G) Quantification of the total number of β cells and the number of β cells that incorporated EdU per larva during DMSO or NECA treatment of control MO-injected or a2aa MO-injected embryos. p values in black refer to Tg(ins:GFP)+, EdU+ cells, whereas the p value in green refers to total number of Tg(ins:GFP)+ cells. n = 11–25 larvae per group. Error bars represent SEM. See also Figure S6. |

NECA Enhances Murine β Cell Proliferation and Glucose Control after STZ-Induced Diabetes (A) Proliferation rate of β cells, displayed as percentage of P-H3-labeled β cells, in isolated mouse islets following 4 days of vehicle or NECA treatment. p < 0.01 for 0.1 μM NECA; p < 0.001 for 10 μM NECA. (B) Blood glucose levels after STZ-induced diabetes and subsequent treatment with vehicle or NECA for 8 days. The blood glucose levels were determined in fed mice. p < 0.001; n = 21 mice for vehicle treated; n = 18 mice for NECA treated. (C) Blood glucose levels in fed and fasted state of STZ-injected mice after 15 days of treatment with vehicle or NECA. p < 0.001; n = 14 mice for vehicle treated; n = 10 mice for NECA treated. (D) β cell mass as determined by the number of insulin-positive cells per unit area (Ins+ cell per μm2) in STZ-injected mice after 15 days of vehicle or NECA treatment. p = 0.0058; n = 5 mice per group. (E) Proliferation of insulin-expressing cells in STZ-injected mice following vehicle or NECA treatment. Quantification of the percent of insulin-positive cells that colabeled with Ki67. p = 0.0019; n = 5 mice per group. (F and G) Representative images of islets in STZ-injected mice after 15 days of vehicle (F) or NECA treatment (G). A Ki67+ Ins+ cell (arrow) in a NECA-treated mouse is shown in the inset (G). Error bars represent SEM. |

Survival of β cells does not significantly contribute to increased regeneration in the presence of the hit-compounds, related to Figure 2. (A-C) As described for Figure 2, we examined β cell survival by photo-converting the fluorescent protein Kaede. At 3 dpf, before ablating the β cells with MTZ between 3-4 dpf, we converted Tg(ins:Kaede)-expressing β cells from green to red by exposing them to UV-light. After two days of regeneration (6 dpf), the surviving β cells are red and green (yellow overlap), whereas the newly formed β cells are green-only. (A-B) We observed β cells that had not yet been ablated and cleared by 6 dpf; however, these cells do not have an active insulin promoter and are therefore red-only (arrows). Because these cells do not seem to be functional they were not included in the quantification presented in Figure 2. (C) Quantification of red-only remnant β cells showed no significant difference between the different treatments, although there was a trend for an increased number of remnant β cells after NECA treatment. n = 10 larvae for each group.(D-F) β cell regeneration was examined with or without a transitional day that allowed β cell ablation to conclude and MTZ to wash out before drug treatment commenced. (D) Regular schema for the β cell regeneration screen. (E) Schema for examining β cell regeneration following a transitional day. (F) Quantification of β cell regeneration using wide-field fluorescence microscopy showing that NECA, Cilostamide, and A-134974 all increased regeneration with equal potency in the regular schema as in the schema with a transitional day. n = 38-66 larvae for each group. Error bars represent SEM. |

NECA-enhanced β cell proliferation is not modified by elevated glucose levels and affects both young and older β cells, related to Figure 3. (A-D) Because of the prominent effect of glucose on β cell proliferation, we tested how NECA interacts with hyperglycemia. To this end, we made use of Formoterol, a -2-adrenoceptor agonist that is known to generate drug-induced hyperglycemia in humans. Tg(ins:GFP) larvae were treated with DMSO/NECA and EdU in the absence or presence of Formoterol from 4-6 dpf to assess the effect of glucose on EdU incorporation in β cells during normal development. (A) Free glucose levels substantially increased after Formoterol treatment from 4-6 dpf, whereas NECA only had a marginal effect on free glucose levels. (B-C) Confocal images of Tg(ins:GFP) larvae treated with NECA and EdU in the absence (B) or presence (C) of Formoterol. β cells that incorporated EdU are indicated by arrows. (D) The number of β cells that incorporated EdU per larva following DMSO or NECA treatment did not change significantly in the presence of Formoterol. n = 10 larvae per group. (E-H) To test if newly formed β cells were more responsive to NECA than slightly older ones, we examined proliferation and neogenesis of β cells simultaneously. To monitor neogenesis of β cells, we made use of Tg(ins:dsRed);Tg(ins:CFP-NTR) animals. In these larvae, β cells that are older than 24 hours are labeled with both Tg(ins:dsRed) and Tg(ins:CFP-NTR) (we visualized CFP by immunohistochemisty in green, and overlap of green and red is shown in yellow). In contrast, because the dsRed fluorescent protein is slow-folding, β cells younger than 24 hours are labeled only by Tg(ins:CFP-NTR) expression (green). By treating Tg(ins:dsRed);Tg(ins:CFP-NTR) larvae with MTZ from 3-4 dpf, DMSO or NECA from 4-6 dpf, and EdU from 5-6 dpf, we could determine whether the β cells that proliferated during the second day of regeneration were actually formed by β cell neogenesis during the first (4-5 dpf) or second (5-6 dpf) day of regeneration. (E) Schema for β cell ablation and treatment with DMSO or NECA and EdU. (F and G) Confocal images of Tg(ins:dsRed);Tg(ins:CFP-NTR) larvae showing EdU incorporation in β cells formed during 4-5 dpf (yellow cells with white nuclei; arrow) and 5-6 dpf (green cells with blue nuclei; arrowhead). (H) Percentage of β cells formed during 4-5 dpf (green bars) or 5-6 dpf (yellow bars) that incorporated EdU during 5-6 dpf in the presence of DMSO or NECA; these data show that NECA enhanced the proliferation of both new (green) and older (yellow) β cells. n = 14-18 larvae per group. Error bars represent SEM. |
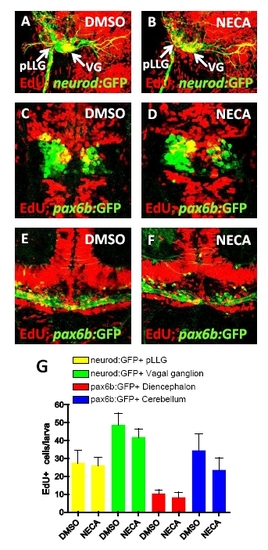
NECA does not increase proliferation of neuronal cells during β cell regeneration, related to Figure 4. (A-B) Proliferation of cells in neuronal ganglia was assessed by EdU incorporation in Tg(neurod:GFP)-expressing cells in the posterior lateral line ganglion (pLLG) and vagal ganglion (VG). Tg(neurod:GFP);Tg(ins:flag-NTR) larvae were treated with MTZ from 3-4 dpf for ablation of the β cells, and subsequently treated with DMSO (A) or NECA (B) and EdU during β cell regeneration from 4-6 dpf. (C-F) Proliferation of neuronal cells in the central nervous system was assessed by EdU incorporation in Tg(pax6b:GFP)-expressing cells in the diencephalon (C-D) and cerebellum (E-F). Tg(pax6b:GFP);Tg(ins:flag-NTR) larvae were treated with MTZ from 3-4 dpf for ablation of the β cells, and subsequently treated with DMSO (E) or NECA (F) and EdU during β cell regeneration from 4-6 dpf. Confocal projections are shown in (A-F) to clearly visualize the structures although EdU incorporation was assessed on each individual plane. (G) Quantification of the number of cells that incorporated EdU in each neuronal compartment. No significant difference was found between DMSO- and NECA-treated larvae. n = 8-13 larvae for each group. Error bars represent SEM. |

NECA treatment does not significantly affect pan-endocrine proliferation/morphology features during normal development, related to Figure 4. (A-E) The transgenic line Tg(neurod:GFP) was used as a pan-endocrine marker in combination with Insulin staining and EdU incorporation between 4-6 dpf, to assess endocrine features at 6 dpf. (A) Confocal projection of a larva treated with DMSO from 4-6 dpf. Note that a secondary islet has formed (white arrow), and the diameter of the principal islet is marked (black arrow). (B) Confocal projection of a larva treated with NECA from 4-6 dpf. (C) No significant difference was found in the number of secondary islets when comparing DMSO- and NECA-treated larvae. (D) Quantification of the number of Tg(neurod:GFP)-expressing cells in the principal islet that had incorporated EdU revealed no significant difference between DMSO- and NECA-treated larvae. (E) The diameter of the principal islet did not significantly differ between DMSO- and NECA-treated larvae. n = 13 larvae for DMSO-treated, and n = 12 larvae for NECAtreated. Error bars represent SEM. |
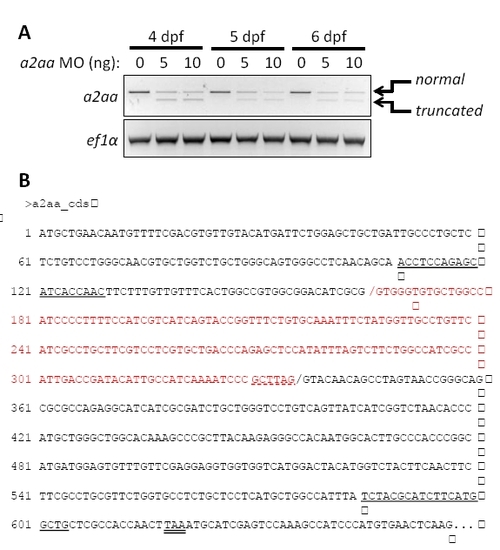
Test of the a2aa splice-blocking morpholino by RT-PCR and sequencing of truncated transcript, related to Figure 5. (A) RT-PCR showing reduced amount of spliced a2aa mRNA in larvae injected with 5 or 10 ng a2aa MO at 4, 5, and 6 dpf. 10 larvae from each condition and stage were used for cDNA synthesis. The a2aa morpholino blocks the splice donor site of the first coding exon (dashed underlined in red) leading to a decreased amount of PCR product as the primers anneal to the first and second exons (underlined sequence). A truncated transcript appeared in the presence of the MO. Equal amounts of cDNA template are indicated by amplification of elongation factor 1-α, using the primers (5′-tcaccctgggagtgaaacagc-3′) and (5′-acttgcaggcgatgtgagcag-3′). (B) Sequence of the normal a2aa cDNA and splice junction (black /). The truncated transcript formed in the presence of the splice blocking MO used an alternative splice junction (red /), leading to the deletion of the sequence labeled in red. This deletion causes a frameshift that creates a premature stop codon (double underlined), thereby leading to a truncated protein of 149 amino acids that only includes 55 out of the 442 amino acids of the full-length A2aa protein. |
Reprinted from Cell Metabolism, 15(6), Andersson, O., Adams, B.A., Yoo, D., Ellis, G.C., Gut, P., Anderson, R.M., German, M.S., and Stainier, D.Y., Adenosine Signaling Promotes Regeneration of Pancreatic beta Cells In Vivo, 885-894, Copyright (2012) with permission from Elsevier. Full text @ Cell Metab.