
- Title
-
Fbxw7 regulates Notch to control specification of neural precursors for oligodendrocyte fate
- Authors
- Snyder, J.L., Kearns, C.A., and Appel, B.
- Source
- Full text @ Neural Dev.
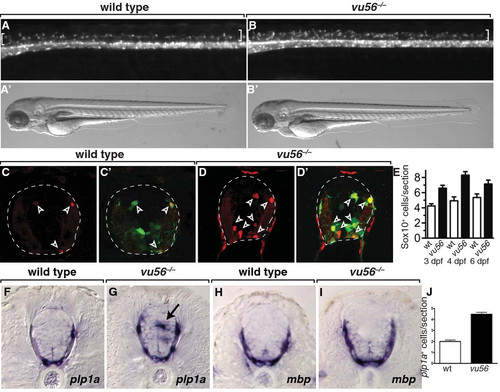
The vu56 mutation causes formation of excess OPCs. (A,B) Lateral images of 3 dpf sibling and vu56 mutants carrying the Tg(olig2:EGFP) reporter marking OPCs in dorsal spinal cord (brackets). Insets show bright field images of living larvae. (C-D′) Transverse sections of sibling and vu56 mutant spinal cords processed for immunohistochemistry to detect Sox10 expression (red, arrowheads). Panels C′ and D′ show Sox10 labeling merged with olig2:EGFP (green). Dashed lines indicate outer edge of spinal cord. (E) Quantification of Sox10+ cells per spinal cord section in wild-type (wt) and vu56 mutant larvae at 3, 4, and 6 dpf (n = 17 wild-type, 19 mutant at 3 dpf (p<0.0001), 7 wild-type and 10 mutant at 4 dpf (p = 0.0002), 5 wild-type and 5 mutant at 6 dpf (p = 0.0357)). (F-I) Transverse sections of 4 dpf wild-type sibling and vu56 mutant larvae, at the level of trunk spinal cord, processed for in situ RNA hybridization to detect plp1a (F,G) and mbp (H, I) expression. Arrow indicates ectopic plp1a expression. (J) Quantification of plp1a+ oligodendrocytes per section in wild-type and vu56 mutant larvae at 4 dpf (n = 4 larvae per genotype; p<0.0001). Error bars represent SEM. EXPRESSION / LABELING:
PHENOTYPE:
|
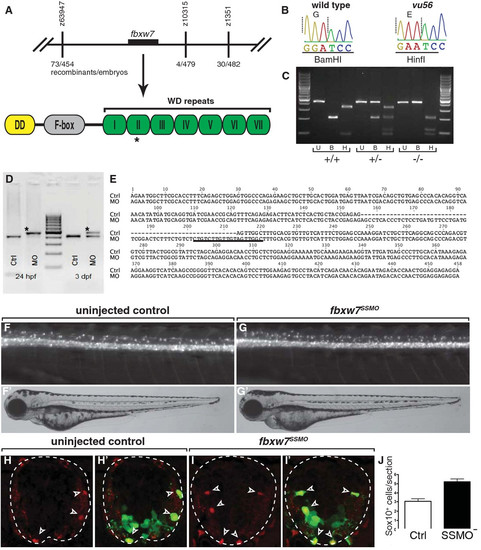
fbxw7 is the gene mutated by the vu56 allele. (A) Schematic representation of genetic mapping and sequencing results. The vu56 mutation mapped to a region of Chromosome 1 containing fbxw7. The vu56 mutation created an amino acid substitution within the second WD repeat of the predicted Fbxw7 protein. (B) Sequence traces from wild-type and vu56 mutant cDNAs. The vu56 mutation changed a G to an A, converting a BamHI restriction site to a HinfI site. (C) RFLP genotyping of homozygous wild type (+/+), heterozygous (+/-) and homozygous mutant (-/-) larvae. U = uncut, B = BamHI digest, H = HinfI digest. (D) RT-PCR analysis of fbxw7 mRNA splicing in control (Crtl) and fbxw7SSMO-injected (MO) 24 hpf embryos and 3 dpf larvae. Upper band in MO lanes (asterisks) indicates splice blocking products. (E) Sequence analysis of RT-PCR products from control embryos, which lack intron 4 sequence (dashed lines) and fbxw7SSMO-injected embryos, which retain intron 4 sequence. Underlined sequence is complementary to the splice-blocking morpholino. (F,G) Lateral images of 3 dpf uninjected control and fbxw7SSMO-injected larvae. Insets show corresponding bright field images. (H-I′) Transverse sections of 3 dpf uninjected control and fbxw7SSMO morpholino injected larvae showing Sox10 expression (red, arrowheads). Panels H′ and I′ show Sox10 labeling merged with olig2:EGFP (green). (J) Quantification of Sox10+ cells per section in control and fbxw7SSMO-injected larvae (n = 8 larvae each genotype; p = 0.0001). Error bars represent SEM. EXPRESSION / LABELING:
PHENOTYPE:
|

fbxw7 gene structure and expression. (A) Schematic representation of fbxw7 gene structure. Three alternative first exons, α, γ, and β, are spliced to exons 2–11. (B) Predicted amino acid sequences of Fbxw7 isoforms. The putative nuclear localization sequence of the α isoform is boxed. (C-F) Transverse sections through the level of the trunk spinal cord showing α and β-specific RNA expression detected by in situ hybridization. At 36 hpf, when pMN precursors initiate OPC formation, medial spinal cord cells α-fbxw7 at relatively high level whereas β-fbxw7 transcripts are only evident at low level in ventral spinal cord. |

Excess OPCs arise from ventral spinal cord precursors in fbxw7vu56 mutant larvae. (A-C′′) Images of spinal cords, from lateral orientation, captured from time-lapse movies of fbxw7+/+ (A-A′′), fbxw7+/- (B-B′′) and fbxw7-/- (C-C′′) larvae carrying the Tg(olig2:EGFP) transgene to mark migrating OPCs. Dorsal is up in all images. Numbers in each panel indicate time (hours, minutes) post fertilization. Red circles mark newly formed OPCs initiating migration from ventral spinal cord. (D) Quantification of OPCs that migrated dorsally in fbxw7+/+ (n = 6), fbxw7+/- (n = 8) and fbxw7-/- (n = 3) larvae from 48 to 63 hpf. (E) Average number of OPC divisions in each genotype. (F,G) Transverse sections of 3 dpf spinal cords labeled with anti-Isl antibody to mark motor neurons (red) in combination with olig2:EGFP expression (green). (H) Quantification of Isl+ cells per section in wild-type sibling and fbxw7-/- larvae (n = 19 wild-type and 17 mutant larvae; p = 0.7658). (I,J) Transverse sections of 3 dpf spinal cords labeled with anti-Sox2 antibody to mark neural precursors (red) in combination with olig2:EGFP expression (green). Oligodendrocyte lineage cells also expressed Sox2 (arrows). Quantification of total spinal cord Sox2+ (K) and Sox2+olig2:EGFP+ (L) cells in wild-type and mutant larvae (n = 17 wild-type and 16 mutant larvae; p<0.0001). (M,N) Transverse sections of 3 dpf spinal cords labeled to detect BrdU incorporation (red) in combination with olig2:EGFP expression (green). Quantification of total spinal cord BrdU+ (O) and BrdU+olig2:EGFP+ (P) cells per section in wild-type sibling and fbxw7-/- larvae (n = 18 wild-type and 15 mutant larvae; p<0.0001). Error bars represent SEM. EXPRESSION / LABELING:
PHENOTYPE:
|
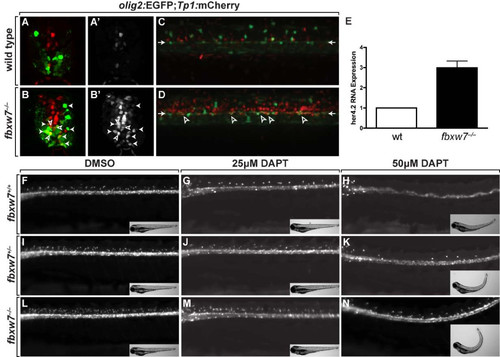
Fbxw7 regulates oligodendrocyte number by regulating Notch signaling. (A,B) Transverse sections of 3 dpf wild-type (A) and fbxw7vu56 mutant (B) spinal cords showing Tp1:mCherry and olig2:EGFP expression. Outlined arrowheads mark Tp1:mCherry+, olig2:EGFP+ precursors. Solid arrowheads indicate Tp1:mCherry+, olig2:EGFP+ oligodendrocyte lineage cells. (A′,B′) Tp1:mCherry images alone. (C,D) Confocal z stack projections, from lateral view, of olig2:EGFP and Tp1:mCherry in 6 dpf wild-type sibling and fbxw7vu56 mutant larvae. Arrowheads point to row of olig2:EGFP+ precursors lining the central canal. Outlined arrowheads mark Tp1:mCherry+, olig2:EGFP+ precursors. (E) Relative levels of her4.2 mRNA in 4 dpf wild-type and fbxw7vu56 mutant larvae determined by quantitative PCR. Wild-type level was assigned an arbitrary level of 1.0 (p = 0.0272). (F-N) Lateral images of living 3 dpf larvae treated with DMSO or DAPT plus DMSO from 36–48 hpf. All larvae carried the Tg(olig2:EGFP) reporter to mark OPCs and oligodendrocytes in dorsal spinal cord. DAPT reduced the number of oligodendrocyte lineage cells in larvae of each genotype. Insets show bright field images of larvae. Each larva was genotyped following the experiment. EXPRESSION / LABELING:
|