- Title
-
Laser ablation of the sonic hedgehog-a-expressing cells during fin regeneration affects ray branching morphogenesis
- Authors
- Zhang, J., Jeradi, S., Strähle, U., and Akimenko, M.A.
- Source
- Full text @ Dev. Biol.
|
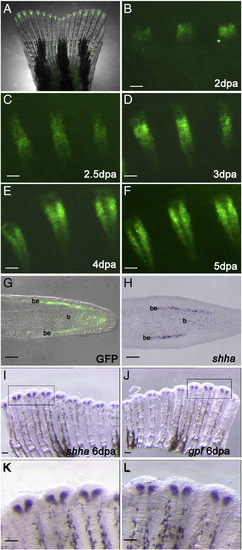
GFP expression recapitulates the endogenous shha expression in the zebrafish transgenic line 2.4shha:gfpABC#15. (A) Bright field and fluorescent images of the caudal fin merge show GFP expression in an intact fin of a 2.4shha:gfpABC#15 transgenic fish. (B–F) Higher magnification of whole-mount images of a few fin rays at different stages of regeneration. (B) At 2 days post amputation (dpa), GFP is expressed in a few cells at the level of the blastema. (C) At 2.5 dpa, GFP expression is restricted to one single domain. (D) At 3 dpa, cleavages start to appear at the proximal end of the GFP-expressing domain and in some rays these cleavages are extending distally. (E) At 4 dpa, a clear separation is visible, and in (F) it is more prominent at 5 dpa. (G) Longitudinal section of a fin regenerate of a 2.4shha:gfpABC#15 transgenic fish at 4 dpa shows GFP expression in the basal layer of the epidermis. (H) In situ hybridization on a longitudinal section of a 4 dpa fin regenerate shows endogenous shha expression in the basal layer of the epidermis. (I–L) In situ hybridization performed on the two lobes of the same fin regenerate at 6 dpa show that shha (I and K) and gfp (J and L) are expressed in the same cell population. The areas indicated by black boxes in I and J are enlarged in K and L. Scale bars in G and H: 20 μm; all other panels: 100 μm. be: basal layer of epidermis; b: blastema. |
|
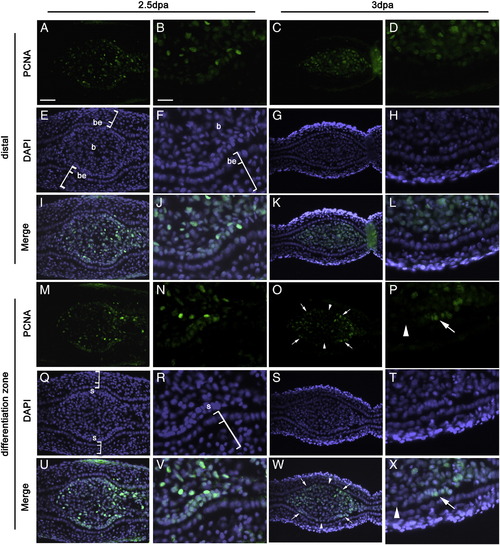
Localized cell proliferation accompanies branch formation. Cell proliferation was detected by immunofluorescence (green) using the proliferating cell nuclear antigen (PCNA) antibody on transverse sections of fin regenerates at 2.5 dpa (A, B, M and N) and 3 dpa (C, D, O and P). DAPI staining (blue) of the same sections is shown in E–H and Q–T. The merged images of the corresponding PCNA and DAPI staining are shown in I–L and U–X. B, F, J, N, R, V, D, H, L, P, T, and X are enlargement of small areas of A, E, I, M, Q, U, C, G, K, O, S, and W, respectively. (A and B) In sections corresponding to the distal part of the fin regenerate at 2.5 dpa, PCNA positive cells are abundant in the blastema. There is no PCNA + cells in the epidermis. (C and D) At 3 dpa, the distribution of PCNA + cells in the distal regenerate is similar to that in (A). (M and N) At 2.5 dpa, in sections corresponding to the differentiation zone, PCNA + cells are more concentrated in the scleroblasts lining the epidermis than in the center of the connective tissue. (O and P) At 3 dpa, as at 2.5 dpa (M), there is a higher concentration of PCNA + cells in scleroblasts than in the central part of the ray but in contrast to 2.5 dpa, the proliferating scleroblasts are localized on the two lateral sides of the hemiray. Note: Bright PCNA staining corresponds to cells that are actively proliferating at the time of tissue fixation. Some residual staining in cells of the connective tissue reflects the past proliferative state of these cells. Arrows in (O, P, W and X) indicate the localized proliferation of the scleroblasts. Arrowheads in (O, P, W and X) indicate the central scleroblasts that show no PCNA signal. Brackets in E, F, Q and R indicate the epidermis. Scale bars: A, E, I, M, Q, U, C, G, K, O, S and W (shown in A) = 20 μm; B, F, J, N, R, V, D, H, L, P, T and X (shown in B) = 7 μm. be: basal layer of epidermis; b: blastema; s: scleroblast. |
|
Controls for the method of laser cell ablation on fin regenerate. Pictures of fin rays were taken before (A, C and E) and immediately after (B, D and F) laser ablation of different cell types of the fin. (A) Shha:gfp-expressing cells in two rays of the 2.4shha:gfpABC#15 transgenic line at 2 dpa. (B) After laser ablation of the cells shown in (A), GFP fluorescence disappears. (C and D) Bright field images of the rays shown in (A and B), respectively, show no visible damage to the tissue following laser ablation. (E) A few epidermal cells of the fin regenerate were labeled by injection of DiI. (F) DiI fluorescence disappears following laser ablation of the targeted cells (arrows in E and F). (G) Fluorescent image of a fin regenerate following ablation of the GFP positive cells in one ray. (H) In situ hybridization immediately after laser ablation of the fin shown in (G) shows shha expression in each fin ray except in the ray on which ablation has been performed. (I and J) In situ hybridization on longitudinal sections of a fin ray with col10a1 probe. (I) Before ablation, col10a1 is expressed in the basal layer of the epidermis (where shha:gfp is also expressed) and in the adjacent scleroblasts. (J) Following ablation of the GFP positive epidermal cells, col10a1 expression in the basal epidermal cells disappears, while col10a1 expression in the scleroblasts remains unchanged. Arrows in (A–H), and the blue brackets in (I and J) indicate the cells targeted for laser ablation. Scale bar in panels I, J = 20 μm. |
|
Laser ablation induces a delay of ray branching. (A) Caudal fin regenerate observed at 21 days following amputation below the first branching point of the rays. Ray numbers are shown in red; the corresponding rays on the ventral and dorsal lobes have the same number (ray 1 that never forms bifurcation is not indicated). Red lines indicate the position of the first branching point of five ray regenerates of the ventral and dorsal lobes, respectively. (B) percentage difference in the position of the origin of bifurcation (measured in number of segments) between the corresponding rays of the dorsal and ventral lobes observed in fin regenerates (n = 30) at 21 dpa. Only 0.07% of the rays show a difference greater than 2 segments of the origin of bifurcation. (C) Fin regenerate at 20 dpl of a 2.4shh:gfpABC#15 transgenic fish after laser cell ablation of the GFP positive cells in rays 2, 3, 4, of the ventral lobe at 3 dpa. The red lines indicate the origin of bifurcation in rays 2, 3, 4 in the control side and the side where laser ablation has been performed, respectively. (D) Graph showing the percentage of rays presenting a difference greater than 2 segments in the position of the origin of bifurcation between the ventral and dorsal lobes, in control fins (no ablation) (left bar) and in experimental fins (right bar) in which GFP positive cells have been ablated in rays of the ventral lobe. Dashed lines indicate the level of amputation. |
|
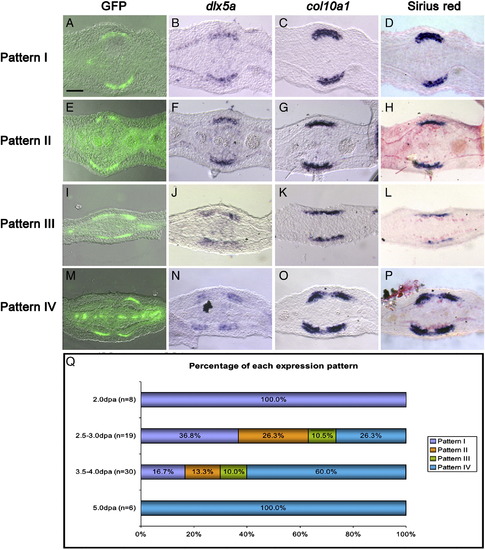
Separation of GFP domain of expression into two precedes separation of the domains of expression of bone markers and bone matrix. Representative examples of the four patterns of expression of GFP (A, E, I and M), dlx5a (B, F, J and N), col10a1 (C, G, K and O) observed in consecutive transverse sections of fin rays collected between 2 and 5 dpa. (D, H, L and P) Picrosirius red staining of the sections shown in (C, G, K and O), respectively. (Q) Percentages of fin rays showing pattern I (A–D), pattern II (E–H), pattern III (I–L), and pattern IV (M–P) at 2.0 dpa, 2.5–3.0 dpa, 3.5–4.0 dpa and 5 pda. Scale bar (all panels): 20 μm. |
|
Laser ablation induces a delay in the splitting of the domain of expression of dlx5a and col10a1. At 6 dpa 3 dpl, control (A, B, C and D) and laser-ablated fin rays (E, F, G and H) were observed for GFP expression (A and E) or collected for gene expression analysis (B, C, D and F) or picrosirius red staining (G and H) on transverse sections. In control fin regenerates, at 6 dpa, (A) GFP expression (B) dlx5a, (C) col10a1 and (D) picrosirius red staining are observed in two separate domains. In experimental fin rays, at 6 dpa, 3 days after ablation of the GFP positive cells, (E) GFP expression is starting to separate in two domains while (F) dlx5a, (G) col10a1 and (H) picrosirius red staining are still observed in a unique domain in each fin ray. Arrows indicate one or two domains of expression/staining per fin ray. Scale bar in panels B–H = 20 μm. |
Reprinted from Developmental Biology, 365(2), Zhang, J., Jeradi, S., Strähle, U., and Akimenko, M.A., Laser ablation of the sonic hedgehog-a-expressing cells during fin regeneration affects ray branching morphogenesis, 424-433, Copyright (2012) with permission from Elsevier. Full text @ Dev. Biol.


