FIGURE SUMMARY
Title

In Vivo imaging of molecular interactions at damaged sarcolemma

Authors
Roostalu, U., and Strähle, U.
Source
Full text @ Dev. Cell

Zebrafish Models for Dysferlinopathy
(A) Comparison of dysf morpholino-injected (i36e37, e18i18) embryos with uninjected control (first panel) at 72 hpf. The i36e37 morphants have slightly bent (second panel) or curved body (third panel), whereas e18i18 morphants (fourth panel) have dorsally bent trunks.
(B) Embryos at 24 hpf, stained with slow muscle myosin antibody F59. No significant defects were obvious in dysf morphants.
(C) F59 staining at 72 hpf reveals gaps (arrow) in the muscles of i36e37 morphants, whereas no defects were observed in e18i18 morphants.
(D) Actin (FITC-phalloidin) staining demonstrates curved myofibers and gaps (arrow) in the i36e37 morphant muscles. e18i18 morphants have slightly misaligned myofibers.
(E) β-sarcoglycan staining shows differences in myoseptal (arrowhead) angle in i36e37 morphants.
(F) Accumulation of Evans blue dye in i36e37 morphant muscle tissue (m). bv, blood vessel.
(G) Birefringence is drastically reduced in i36e37 morphants at 72 hpf, whereas no difference was noted in e18i18 morphants in comparison with control larvae.
(H–K) Electron microscopy (sagittal sections) of 72 hpf myofibers. Plasma membrane is electron dense. (H) shows uninjected control larval myofiber with correctly aligned sarcomeres and T-tubules (arrows). (I) shows extensive muscle damage in i36e37 morphant myofibers. In (J), a high-magnification image of i36e37 morphant myofiber shows misplaced T-tubule fragments (arrows). In (K), vesicles (arrowheads) are widespread in damaged i36e37 morphant myofibers.
(L) Zebrafish Dysf protein structure: C2, C- and N-terminal Dysf (DC and DN) as well as the TM domain are indicated. Vertical lines point to morpholino target sites.
(M) Sequence alignment of human and zebrafish Dysf C2E domain (underlined). The arrowhead points to the splice site, targeted by morpholino i36e37. Magenta letters outline the region, which is missing in i36e37 morphants. Additional transcript is present in the morphants, lacking the whole protein region, downstream from the morpholino target site. Asterisks indicate mismatch substitutions that cause myopathy in humans; x denotes mutations, resulting in premature stop codon in human DYSF.
(N) Sequence alignment of the Dysf protein region targeted by e18i18 morpholino. Letters in magenta indicate the deleted part in the morphants. Orientation of embryos A–G: anterior left, dorsal up.Scale bars represent 500 μm (A and G); 80 μm (B, C, E, and F); 20 μm (D); 6 μm (C); 2 μm (H–I); 1 μm (J and K). See also Figure S1.

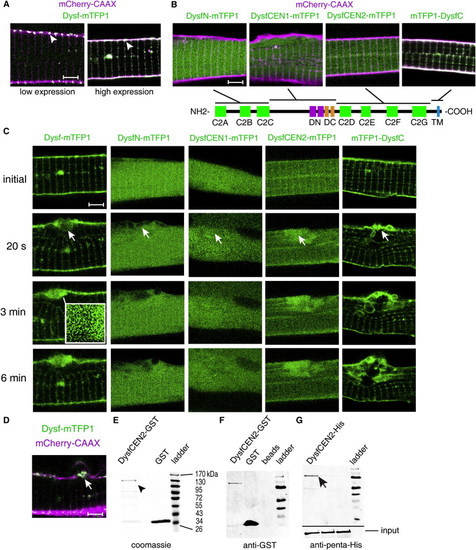
Characterization of Dysf and Its Response to Cell Lesions
Full-length Dysf or parts of it were fused to mTFP1 (green) and expressed in zebrafish. mCherry-CAAX marks cell membrane in magenta.
(A) At low expression levels (left), Dysf accumulates preferentially at the neck regions of T-tubules (arrowhead) but is more uniformly distributed along the plasma membrane at higher levels (right).
(B) Domain architecture of Dysf and subcellular location of individual regions. mTFP1 was fused to the C terminus, except for the TM domain (DysfC construct), where it was fused to the N-terminus. Only the C-terminal part of Dysf (DysfC) localizes to the plasma membrane.
(C) Response of Dysf, Dysf N-terminal domain (DysfN), DysfCEN1, DysfCEN2, and DysfC to membrane lesions (arrow). Dysf accumulates at the site of lesion. Vesicular structures are visible at high magnification (insert). Although DysfN and DysfCEN1 do not accumulate in the lesion, there is an increase of DysfCEN2 and DysfC.
(D) Dysf accumulation at the site of damage in a cell with a low expression level of the fusion protein.
(E) Purified DysfCEN2-GST (arrowhead) and glutathione S-transferase (GST) proteins on SDS PAGE gel.
(F and G) Protein pull-down experiment with recombinant GST- and His-tagged proteins.
(F) shows an anti-GST stained western blot;
(G) shows the same blot stained with anti penta-His antibody. DysfCEN2-His (97kDa, black arrow) was pulled down by DysfCEN2-GST but not with GST alone or sepharose beads. Lower section shows 20% of His-tagged protein input.Scale bars represent 4 μm (A–D) and 0.4 μm (C insert). See also Figure S2.

Origin of the Repair Membrane
(A and B) Schematic representation of the two possible sources of the sarcolemmal resealing membrane. (A) Random plasma membrane fragments, decorated with mCherry-CAAX (magenta) or Dysf (green) could provide substrate for membrane repair. (B) Specific Dysf-enriched membrane domains exist for resealing of lesions.
(C) FRAP experiment with mOrange1-tagged DysfC and mCherry-CAAX show comparable kinetics in undamaged myofibers.
(D) The TM domain of Dysf (DysfC) accumulates rapidly at the site of lesion. Much slower or no accumulation was observed for mCherry-CAAX, mTFP1-SNAP23 and Cav3-mTFP1.
(E) Coexpression of mTFP1-DysfC and mCherry-CAAX. In contrast to mTFP1-DysfC (green), mCherry-CAAX (magenta) does not accumulate in the lesion.
(F) Visualization of Lamp1-mTFP1, mTFP1-Rab1a, mTFP1-Rab5a, mTFP1-Rab6a, mTFP1-Rab7, mTFP1-Rab12, mTFP1-Rab27a, and mTFP1-Stx4 localization (green) in uninjured and injured cells. No significant relocation of the studied vesicle markers could be observed. mCherry-CAAX marks the cell membrane in magenta. White arrow indicates damaged sarcolemma.
Scale bars represent 3 μm (E) and 4 μm (F). See also Figures S2 and S3.

Annexin Kinetics in Myofibers
(A) Comparative relocation kinetics of annexins. Green letters in name or pie graph sector denote annexin tagged with mTFP1, and magenta letters indicate fusion to mOrange1. The pie graph illustrates relative intensity of the two fluorophores in the lesion. Anxa6 and Anxa11a are the fastest to accumulate in the wound, followed by Anxa2a and Anxa1a.
(B) Kinetics of mTFP1-tagged annexins at the site of the lesion (mean from eight experiments). Anxa6-mTFP1 showed a rapid increase in the lesion, whereas a time delay was observed for other annexins.
(C) FRAP was carried out with annexins tagged with mOrange1 (mean of 25 experiments). The motility of different annexins in the cytoplasm is comparable.
(D) Domain architecture of zebrafish annexins. Green boxes denote Ca2+-sensitive domains. Sizes are proportional to sequence length.
(E) Accumulation of mutant Anxa6, missing the 4 C-terminal Ca2+-sensing domains, is impaired in comparison with full-length Anxa6; compare with the Anxa6 panel in (B).Scale bars represent 4 μm. See also Figure S4.

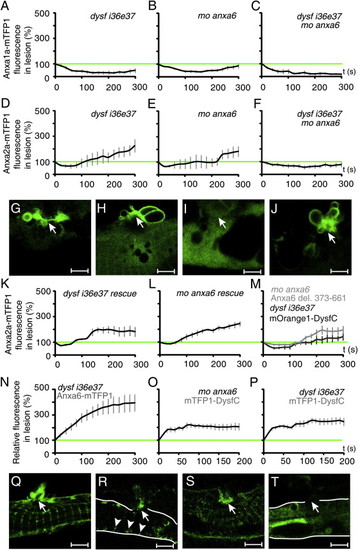
Distribution of Annexins in the Lesion and the anxa6 Morphant Phenotype
(A) FRET was carried out to map the spatial distribution of annexins at high resolution. The lower triangle demonstrates FRET signal (designated as F), upper triangle and lower panel (surrounded by boxes) show the extent of damage by the colocalization of the two proteins. In each panel, the combination of annexins coexpressed are indicated by numbers (1: Anxa1a; 2: Anxa2a; 6: Anxa6; 11: Anxa11a), and the color identifies the fusion to mTFP1 (green) or mOrange1 (orange).
(B) Control of FRET experiments. No FRET (left) when mOrange1 and mTFP1 were coexpressed without fusion to annexins. Overlay of mOrange and mTFP1 is shown on the right.
(C) Quantitative analysis of FRET signal intensity in the lesion (mean of five experiments).
(D) Injection of anxa6 morpholino leads to curved trunk by 3 days of development.
(E and F) Slow muscle myosin staining (F59 antibody) shows largely normal muscle development at 24 hpf (E), but reveals gaps (arrows) between myofibers at 72 hpf (F).
(G) Deeper muscle sections were visualized with phalloidin-stained actin. Curved myofibers and gaps (arrows) were evident.(H) β-sarcoglycan staining of obtuse myoseptal angles.(I) Only very few cells (arrowhead) in the muscle tissue of anxa6 morphants became penetrable to Evans blue dye. bv, blood vessel.
(J) Birefringence is only moderately affected in anxa6 morphants.
(K–M) Electron microscopy of anxa6 morphant myofibers. Cell membrane is electron dense. In large areas, proper myofibril organization was present (K), whereas occasional damage could also be detected (L, arrows). (M) shows accumulation of vesicles (arrowheads) at the site of myofiber damage. Orientation of embryos (D–J): anterior left, dorsal up.
Scale bars represent 6 μm (A and B); 500 μm (D and J); 80 μm (E, F, H, and I); 20 μm (G); 2 μm (K and L); 1 μm (M). See also Figure S1.

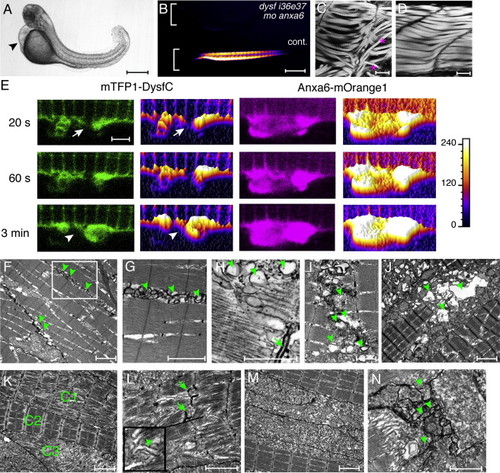
Anxa6/Dysf Double Morphant, Anxa6/Dysf Coexpression, and Ultrastructural Characterization of Muscle Damage
(A) Anxa6 and dysf (dysf i36e37) double morphants have curved body and severe cardiac edema (arrowhead) at 72 hpf.
(B) Muscle birefringence is almost completely absent.
(C) Misalignment (asterisks) and gaps between myofibers are visible by actin staining in the double morphants.
(D) Actin staining demonstrates normal myofiber alignment in uninjected control larvae.
(E) The accumulation of mTFP1-Dysf-coated membrane at the lesion (arrow) is rapid and coincides with Anxa6-mOrange1 appearance at the damaged sarcolemma. Increased fluorescence is depicted by lighter colors and higher surface plot profile. Note that the initial accumulation appears at the edges of the sarcolemma, from where it spreads over the damaged area, which is eventually sealed (arrowhead).
(F–N) Electron microscopy of 72 hpf myofibers. In (F), veratridine treatment leads to vesicle (arrowhead) accumulations under the sarcolemma in WT myofiber. In (G), high-magnification is shown of the boxed area in (F). In (H), cytoplasmic vesicles (arrowhead) often arise close to T-tubules (arrow). In (I), membrane blebbing and vesicles (arrowheads) could be observed at sites of fiber rupture. In (J), veratridine treatment leads to extensive muscle damage in anxa6 morphants. Large vacuolar structures (arrowheads) can be seen around ruptured myofibers. In (K), veratridine treatment enhances muscle damage in dysf i36e37 morphants. In some areas, correct sarcomeric filament alignment was evident (C2), whereas in other areas, it was significantly impaired (C1) or completely absent (C3).
(L) High-magnification image of veratridine-treated dysf i36e37 morphant muscle demonstrates misaligned sarcomeres, accumulation of vesicles (arrowhead) in the cytosol and T-tubule damage (arrows). The insert shows a magnified area (1 × 1 μm).
(M and N) Anxa6 and dysf double morphants have severe muscle damage in untreated (M) and veratridine-treated (N) conditions. Membrane blebbing and vesicles (arrowheads) could be detected at sites of cell rupture after veratridine treatment. Orientation of embryos in (A–D): anterior left, dorsal up.
Scale bars represent 500 μm (A and B); 20 μm (C and D); 1.6 μm (E); 2 μm (F, G, and J–M); 1 μm (H, I, and N).

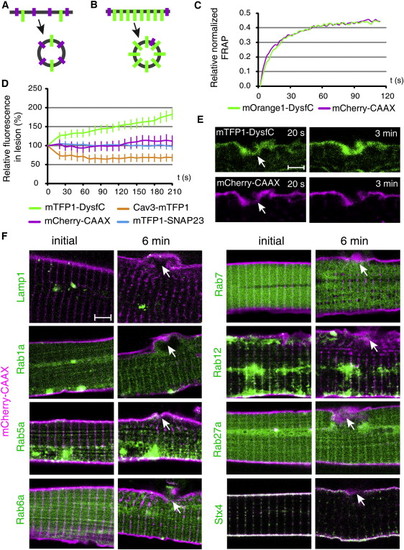
Functional Interactions in Repair Patch Formation
(A–I) Anxa1a accumulation is impaired in dysf i36e37 morphants (A), anxa6 morphants (B) and dysf/anxa6 double morphants (C). Anxa2a-mTFP1 accumulation is delayed in dysf i36e37 morphants (D), severely perturbed in anxa6 morphants (E) and impaired in dysf/anxa6 double morphants (F). The repair patch (arrow) morphology at the 3 min time point after damage (as illustrated by Anxa2a-mTFP1) is severely affected in dysf i36e37 morphants (G) and in anxa6 morphants (H). Anxa2a diffuses out of the cell at the 3 min time point after membrane rupture (arrow) without aggregating into a patch in double morphants (I).
(J) In a few cases, larger vesicles were visible in the double morphants.
(K) Full-length Dysf-mOrange1 rescues Anxa2a-mTFP1 recruitment in dysf i36e37 morphants.
(L) Anxa6-mOrange1 rescues Anxa2a-mTFP1 accumulation in anxa6 morphants.
(M) Expression of mOrange1-DysfC or Anxa6 del-mOrange1 (lacking 4 C-terminal Ca2+-sensitive domains) do not rescue Anxa2a-mTFP1 patch formation in dysf i36e37 or anxa6 morphants, respectively.
(N) Anxa6-mTFP1 rapid response is not perturbed in dysf i36e37 morphants.
(O) mTFP1-DysfC response to membrane damage is not affected in anxa6 morphants.
(P) Unperturbed mTFP1-DysfC accumulation at the site of sarcolemmal lesion in dysf i36e37 morphants.
(Q) mTFP1-DysfC accumulation at the sarcolemmal rupture (arrow) in anxa6 morphants at 60 s after damage.
(R) Full-length Dysf-mTFP1 is maintained at the T-tubule neck regions (arrowhead) and accumulates at the site of sarcolemmal lesion (arrow) in anxa6 morphants (3 min after damage).
(S) mTFP1-DysfC accumulation at the site of sarcolemmal lesion (arrow) in dysf i36e37 morphants at 3 min after damage.
(T) mTFP1-Rab27a does not respond to membrane damage (arrow) in dysf i36e37 morphants (3 min after damage). In all the charts (A–F, K–P), the change at the site of lesion is indicated as percentage relative to the undamaged state (green line; mean from 6–10 experiments). Cell is outlined in white in (R) and (T). Arrow in (G–J) and (Q–T) indicates site of damage.Scale bars represent 4 μm. See also Figure S5.

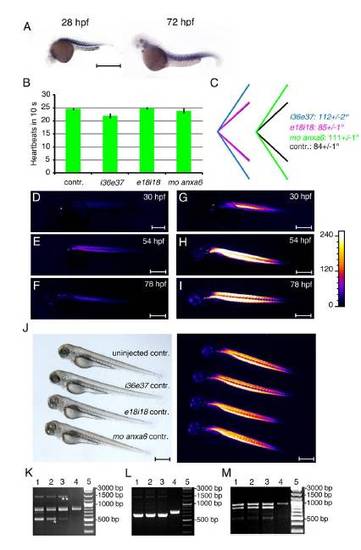
Characterization of dysferlin expression and morpholino-injected embryos.
(A) In situ hybridization of dysferlin (dysf) illustrates muscle specific expression at 28 hpf (hours post-fertilization) and at 72 hpf. (B) i36e37 morphants show a slight decrease in heart function, whereas no significant difference was observed for dysf e18i18 or annexin A6 (anxa6) morphants at 72 hpf. (C) Myoseptal angles in dysf i36e37 and anxa6 morphants were significantly different from controls. (D-F) Birefringence imaging over a 48 hour period in a single dysf i36e37 morphant. An initial increase in birefringence could be detected until 54 hpf stage, followed by a drastic loss of muscle structure in the next 24 hours. (G-I) Birefringence imaging in a single uninjected WT embryo. Gradual increase in muscle birefringence could be observed over the 48 hour period. (J) Five-mismatch control morpholinos injected at one cell stage did not induce any phenotypic difference in 3 day old animals. Muscle birefringence (right image) was unaltered. (K-M) Molecular characterization of splicing pattern in morpholino-injected embryos. Total RNA was extracted from single embryos and subjected to RT-PCR (lanes 1-3, morphants; lane 4 control embryo; lane 5, DNA size markers). All PCR products were additionally verified by sequencing. (K) i36e37 morpholino induced removal of exons 37-38 (asterisk), eliminating 80 amino acids, including 32 amino acids of the C2E domain. Alternatively, addition of intron 36 occurred (two asterisks), introducing a premature stop codon after 1393 amino acids. (L) e18i18 morpholino led to 78 bp deletion inside dysf (amino acids 610-635). (M) Anxa6 morpholino caused removal of 94 bp exon, leading to premature stop codon and truncation of the protein after 177 amino acids. Orientation of embryos: anterior left, dorsal up. Scale bar, 500 μm.

EXPRESSION / LABELING:
Gene:
Fish:
Anatomical Term:
Stage Range: Prim-5 to Protruding-mouth
PHENOTYPE:
Fish:
Knockdown Reagent:
Observed In:
Stage: Protruding-mouth

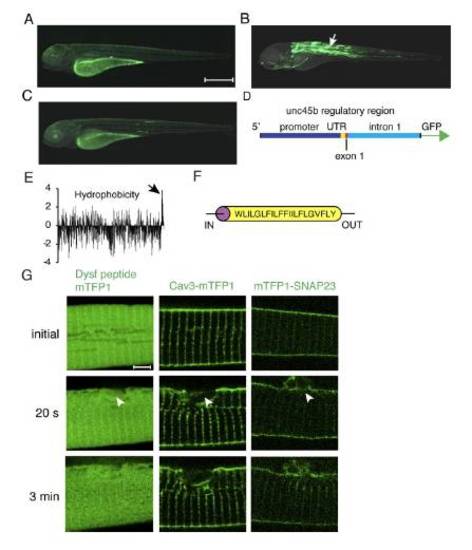
Characterization of the unc45b regulatory region. Dysferlin in silico analysis and membrane protein response to sarcolemmal damage. (A) GFP expression driven by the unc45b promoter from -1799 to -108 relative to the ATG, (B) the unc45b promoter together with the UTR, first exon and the first intron (-1799 to + 1534), (C) the unc45b intron alone upstream of the GFP coding sequence.Schematic illustration of the construct used in (B), ranging from -1799 bp to +1534 bp relative to the unc45b ATG. While the promoter and the intron alone result in weak or no muscle expression (A, C; note the expression in the yolk is unspecific), the full length construct (-1799 to +1534 bp relative to the ATG) of the unc45b gene drives robust expression in the muscle (B, arrow). The first intron of unc45b encompasses a strong transcription enhancer, resulting in specific mosaic expression in skeletal and cardiac muscle cells in transient expression assays. Orientation of embryos: anterior left, dorsal up. (E) In silico analysis of zebrafish dysferlin (Dysf) hydrophobicity (Kyte and Doolittle blot). Positive values on the vertical axis indicate hydrophobic regions. The C-terminus of the protein is towards the right and the arrow points to the transmembrane domain. The majority of Dysf is hydrophilic and the hydrophobic transmembrane domain is followed by a 22 amino acid long hydrophilic stretch at the very C-terminus. (F) Dysf transmembrane domain prediction. (G) No accumulation of Dysf C-terminal 22 amino acid peptide, caveolin 3 (Cav3-mTFP1) or mTFP1-SNAP23 (Soluble NSF Attachment Protein 23) could be observed in ruptured (arrowhead) sarcolemma. Scale bar: A-C, 500 μm; G, 4 μm.

Damage response of vesicle markers. (A) Lysosome-associated protein transmembrane 4a (Laptm4a) or lysosome-associated membrane protein 2 (Lamp2), fused to mTFP1 in their C-terminus (green) were co-expressed with prenylated mCherry (magenta). Cells were damaged (arrow) with the two photon laser and localization of lysosomal markers was recorded. No large-scale redistribution of lysosomes was evident, although limited amount of mTFP1 could occasionally be observed near the lesion. (B-C) Quantification of lysosome dynamics at the site of lesion. Fluorescence change (%) relative to 20 s time point after injury is depicted. (D) Lysosomes (arrowhead) were observed near the lesion (arrow) only when the rupture occurred close to them. Even then, they did not relocate and fuse to the membrane. (E) Quantification of various endocytosis or exocytosis markers at the site of sarcolemmal lesion. The vertical axis demonstrates fluorescence change at the site of lesion (%) relative to the 20 s time point. Due to the irregular distribution of the vesicles across the cell, the analysis was carried out relative to the 20 s time point. By this time mTFP1-DysfC had already significantly increased at the site of lesion, yet still continued to accumulate also afterwards. Such clear trend could not be observed for any of the studied vesicle markers. Scale bars: A, 4 μm; D, 2 μm

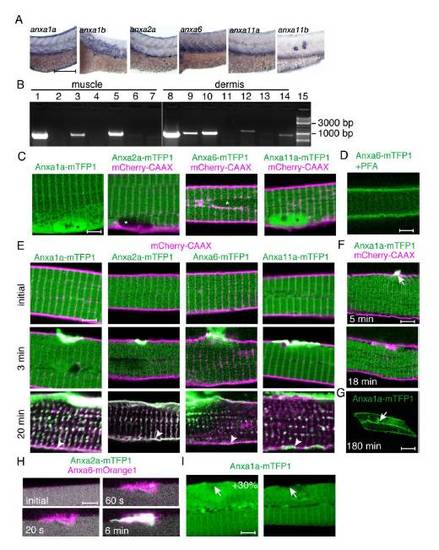
Expression and subcellular localization of annexins in zebrafish. (A) In situ hybridization of annexins anxa1a, anxa1b, anxa2a, anxa6, anxa11a and anxa11b was carried out at 72 hpf (hours post-fertilization). Lateral view of the trunk region is shown. Expression of anxa1a and anxa2a is detectable in the muscle (mRNA enriched at the myoseptal regions) and in the periderm. Anxa6 is highly expressed in the muscle tissue, whereas by 72 hpf only limited amount of anxa11a could be detected in the muscle. Anxa1b and anxa11b expression are limited to the periderm. (B) Reverse transcriptase-PCR was carried out on adult zebrafish skeletal muscle (lanes 1-7) and dermis (lanes 8-14) samples: anxa1a (lanes 1, 8), anxa1b (lanes 2, 9), anxa2a (lanes 3, 10), anxa2b (lanes 4, 11), anxa6 (lanes 5, 12), anxa11a (lanes 6, 13) and anxa11b (7, 14). DNA ladder: 15. Anxa1a, anxa2a and anxa6 are abundant in adult zebrafish muscle tissue. (C) In addition to cytoplasmic localization, strong nuclear signal (asterisk) is visible for Anxa1a and Anxa11a, when fused with mTFP1 (green). Weaker nuclear accumulation is evident for Anxa6-mTFP1 and no nuclear signal could be detected for Anxa2a-mTFP1. mCherry-CAAX marks the cell membrane in magenta. (D) Translocation of Anxa6-mTFP1 to the cell membrane in paraformaldehyde fixed animals. (E) Annexins tagged with mTFP1 (green) accumulate in the sarcolemmal lesion after injury (arrow). Larger cellular wounds eventually lead to the binding of annexins to the membrane distant from the site of injury (arrowhead). (F) Small sarcolemmal wounds lead to temporary accumulation of Anxa1a at the lesion. (G) Large wounds result in persistent Anxa1a localization at the plasma membrane. (H) The relative accumulation kinetics of the studied annexins does not depend on lesion size. Anxa6-mOrange1 (purple) accumulates faster in the large lesion than Anxa2a-mTFP1 (green). Similar results were obtained for small lesions (compare to Figure 4A). (I) Accumulation of annexins does not depend on the expression level. Two cells with 30% difference (largest difference in the study) of Anxa1a-mTFP1 expression were injured. In none of them did the accumulation take place at 60 s after rupture. Scale bars: A, 185 μm; C-F, H-I, 4 μm; G, 65 μm.

Annexin damage response. (A-H) Anxa2a-mTFP1 at the sarcolemmal rupture (arrow) at 3 min time point after damage. Anxa2a-mTFP1 response to sarcolemmal lesion was unperturbed in dysf control morpholino-injected embryos (A, D) and in anxa6 control morpholino-injected embryos (B, E). (F) Dysf-mOrange1 rescues Anxa2a-mTFP1 repair patch morphology in dysf i36e37 morphants. (G) Anxa6-mOrange1 rescues Anxa2a-mTFP1 repair patch morphology in anxa6 morphants. (C, H) Unaltered Anxa2a-mTFP1 accumulation and patch formation in dysf e18i18 morphants. Scale bar: A-D, F-G, K-O, 4 μm; E, 65 μm.

Acknowledgments
This image is the copyrighted work of the attributed author or publisher, and ZFIN has permission only to display this image to its users. Additional permissions should be obtained from the applicable author or publisher of the image.

Reprinted from Developmental Cell, 22(3), Roostalu, U., and Strähle, U., In Vivo imaging of molecular interactions at damaged sarcolemma, 515-529, Copyright (2012) with permission from Elsevier. Full text @ Dev. Cell