
- Title
-
Intravital Imaging of Thymopoiesis Reveals Dynamic Lympho-Epithelial Interactions
- Authors
- Hess, I., and Boehm, T.
- Source
- Full text @ Immunity

Dynamic Nature of Thymus Homing (A) Schematic of the transgenic construct to direct expression of mCherry to thymic epithelial cells. The mCherry cDNA was inserted in-frame into the second coding exon of the foxn1 gene via homologous recombination in bacteria of a BAC spanning the entire foxn1 gene and extending into flanking genes. (B) The thymic epithelial anlage (encircled by dotted line) exhibits red fluorescence in foxn1:mCherry transgenic fish. Major anatomical landmarks are highlighted; ov, otic vesicle. The photograph was taken at 50 hpf, before the colonization of the thymic rudiment by lymphocyte progenitors. Photograph representative of four embryos. Scale bar rerpresents 10 μm. (C) Still photographs of a time-lapse recording of a representative double-transgenic wild-type embryo (ikaros:eGFP [green fluorescence]; foxn1:mCherry [red fluorescence]). The still series begins at 57.5 hpf (00 hr:00 min). Note the intimate contact between lymphoycte progenitors and thymic epithelium, particularly evident at 09:54. Representative results for 20 embryos. Scale bar represents 5 μm. See also Movie S1. (D) Still photographs of a time-lapse recording of a representative double-transgenic ikaros-/- mutant embryo (ikaros:eGFP [green fluorescence]; foxn1:mCherry [red fluorescence]). The still series begins at 57.5 hpf (00 hr:00 min). Note the presence of numerous myeloid cells that migrate across the perithymic field but do not make contact with the thymic epithelium. Representative results for 12 embryos. Scale bar represents 5 μm. See also Movie S2. (E) Schematic of the transgenic construct to direct expression of tdEosFP to hematopoietic progenitor cells. The tdEosFP cDNA was inserted in-frame into the second coding exon of the ikaros gene via homologous recombination in bacteria of a BAC spanning the entire locus (Bajoghli et al., 2009). (F) Trajectory (blue line) of a thymus-settling cell exhibiting the characteristic in-out-in pattern of migration. Intrathymic cells were marked by photoconversion from green to red fluorescence; the selected cell leaves the thymus in the region indicated by the dotted circle and returns to the thymus after migration through the perithymic mesenchyme (end of blue line). Representative of 116 events. Scale bar represents 10 μm. (G) Still photographs from a time-lapse recording illustrating the in-out-in pattern of migration as in (F). The still series begins at 63 hpf (00 hr:00 min); arrows mark the same cell in all frames. Scale bar represents 10 μm. See also Movie S3. (H) Characteristics of in-out-in migration. Patterns were recorded for single cells (n = 9); each cell is indicated by a different color and periods in extrathymic tissues are indicated by arrows. (I) Distribution of extrathymic and intrathymic residence times for single cells shown in (H) (mean ± SD). (J) Extrathymic residence times for 116 events over a period of 15 hr; 0 denotes 57.5 hpf, as the starting point for the recording. Data pooled from observation of 16 embryos. (K) Quantitative analysis of data in (J). Extrathymic residence times for two consecutive 7.5 hr periods are shown (mean ± SD). |
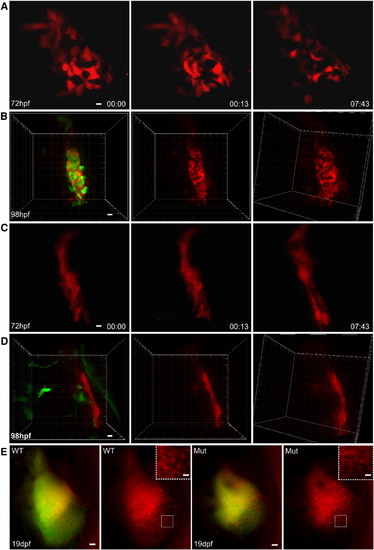
Morphological Transformation of Thymic Epithelial Cells upon Contact with Lymphocyte Progenitors (A) Still photographs of a time-lapse recording of a representative double-transgenic ikaros+/+ embryo (ikaros:eGFP [green fluorescence]; foxn1:mCherry [red fluorescence]). The still series begins at 72 hpf (00 hr:00 min). Only the red channel is shown to demonstrate the rapid changes of cell shape of thymic epithelial cells. Representative results for ten embryos. Scale bar represents 5 μm. (B) Three-dimensional rendering of the thymic anlage in a double-transgenic ikaros+/+ fish to demonstrate the many intimate contacts between lymphocytes and epithelial cells. Representative results for ten embryos. Scale bar represents 5 μm. (C) Still photographs of a time-lapse recording of a representative double-transgenic ikaros-/- embryo (ikaros:eGFP [green fluorescence]; foxn1:mCherry [red fluorescence]). The still series begins at 72 hpf (00 hr:00 min). Only the red channel is shown to demonstrate the undifferentiated nature of thymic epithelial cells in the absence of lymphocyte progenitors in the thymus. Representative results for ten embryos. Scale bar represents 5 μm. (D) Three-dimensional rendering of the thymic anlage in a double-transgenic ikaros-/- fish to demonstrate the blunted appearance of thymic epithelial cells. Representative results for ten embryos. Scale bar represents 5 μm. (E) Onset of morphological transformation of thymic epithelial cells upon contact with lymphocyte precursors. Still photographs of time-lapse recordings of double-transgenic ikaros+/+ (wt) ikaros-/- (mut) embryos. The photographs were taken at 19 dpf. Red and green channels are combined in the first and third panel; the red channel only is shown in the second and fourth panel. The insets highlight the indistinguishable reticular shape of thymic epithelial cells in both embryos after colonization of the thymus. Representative results for three wild-type and three mutant embryos. Scale bar represents 5 μm. See also Figure S1. EXPRESSION / LABELING:
PHENOTYPE:
|

Three Major Routes of Thymus Colonization (A) Schematic highlighting major anatomical structures relevant to the three major sites of extravasation (numbered in order of importance) of lymphocyte progenitors. The distribution of 131 exit events (recorded from 15 embryos for the 52–68 hpf observation period) among the three sites is shown on the right. (B) Still photographs of a time-lapse recording of a representative triple-transgenic embryo (ikaros:eGFP [green fluorescence]; foxn1:mCherry [red fluorescence]; flk1:CFP [blue fluorescence]). The still series begins at 53 hpf (00 hr:00 min). The sites of extravasation from vessels are numbered as in (A); lymphocyte progenitors exhibit bright green fluorescence. The marked regions are displayed in higher magnifications in the insets. For details, see text. Note that some neurons in the retina and the brain also express ikaros; a subset of skin cells also expresses foxn1. Representative results for ten embryos. Scale bars represent 50 μm for overviews, 5 μm for insets. See also Figure S2 and Movie S4. EXPRESSION / LABELING:
|
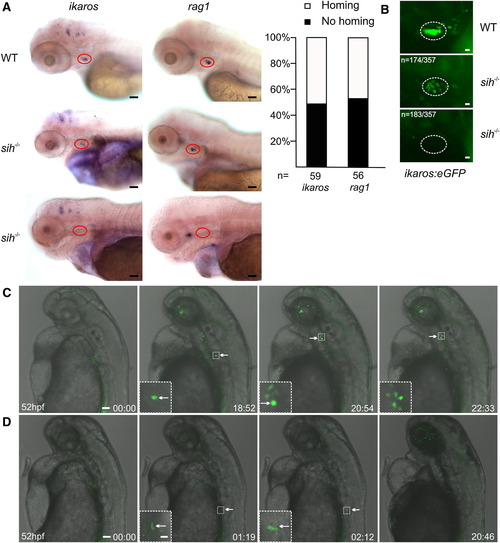
Blood Circulation Is Not Required for Thymus Homing (A) Whole-mount RNA in situ hybridization with antisense ikaros- and rag1-specific probes of wild-type (wt; top row) and silent heart mutant (sih-/-; middle and bottom rows) embryos at 4 dpf. The thymus is highlighted by red circles; lateral views. About half of sih-/- embryos contained at least one positive cell in the thymic rudiment at this time point (histograms at right). Representative results for 70 wild-type and 59 and 56 mutant embryos. Scale bars represent 50 μm. (B) A similar analysis of WT and sih-/- fish additionally transgenic for ikaros:eGFP yielded similar results. Representative results in <400 wild-type and 174 and 183 mutant embryos. Scale bars represent 10 μm. (C) Still photographs from a time-lapse recording tracking a thymus-settling precursor in a sih-/- mutant with eventual thymus colonization. The still series begins at 52 hpf (00 hr:00 min); several other time points are shown including high-power views of relevant regions (insets). Representative results for four embryos. Scale bars represent 50 μm for overviews, 10 μm for insets. See also Movie S5. (D) Still photographs from a time-lapse recording of a sih-/- mutant without thymus colonization. The cell shown at 01:19 and 02:12 time points is a myeloid cell, which shows normal migratory behavior. Representative results for four embryos. Scale bars represent 50 μm for overviews, 10 μm for insets. See also Movie S6. |

Expression Domains of ccl25 and cxcl12 Chemokines in 3 dpf Embryos (A) Whole-mount double-fluorescence RNA in situ hybridization of foxn1 (red fluorescence) and ccl25a (green fluorescence). The colocalization in thymic epithelia of foxn1 and ccl25a was revealed by confocal fluorescence microscopy. Representative results for <50 embryos. Scale bars represent 5 μm. (B) High-resolution double-colorimetric RNA in situ hybridization for the indicated genes; color code corresponds to the images shown in lateral (first column), dorsal (second column), and high-power (third column) views. Expression of ccl25a marks the thymic epithelium (see A). The red and green circles mark the thymus and the parathymic regions, respectively. Representative results for <50 embryos. Scale bars represent 50 μm for overviews, 20 μm for high-power views. See also Figure S3. EXPRESSION / LABELING:
|
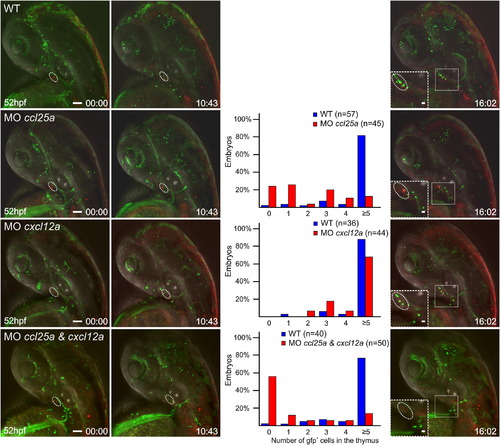
Chemokines Regulate Thymus Homing Double-transgenic fish (ikaros:eGFP [green fluorescence]; foxn1:mCherry [red fluorescence]) were injected with gene-specific antisense morpholinos singly or in combination. The type of gene-specific morphant is indicated at the top of panels in the first column. The cxcl12b morphant exhibits a prethymic defect. See also Figures S4–S6. Shown are still photographs from movies taken at several different time points, beginning at 52 hpf (00 hr:00 min; first column). The panels of the latest time point (fourth column) contain insets depicting enlargements of the thymic (white dotted line) and parathymic regions. At 63 hpf, the numbers of cells present in the thymic rudiments (marked with circles) was determined and are presented in the third column. The presence of e5 cells per rudiment was considered to be indicative of normal colonization; hence, for statistical purposes, the fraction of embryos with 0–4 intrathymic cells was compared to those containing e5 cells: ccl25a morphant, p < 1.274 × 10¹²; cxcl12a morphant, p < 0.033; ccl25a and cxcl12a double-morphant, p < 8.32 × 10¹⁰; Fisher′s exact probability test. The numbers of embryos analyzed for each group are indicated. Scale bars represent 50 μm for overviews, 10 μm for high-power views (insets). The numbers of embryos that were subjected to the analyses are shown in each panel. See also Movie S7. Thymus Homing Process in a Double-Transgenic Wild-Type Embryo and Movie S8. Thymus Homing Process in a Double-Transgenic Embryo Injected with Morpholinos Targeting ccl25a and cxcl12a. |

Intrathymic Motility and Egress of T Cells (A) Still images taken from a time-lapse recording of ikaros:tdEosFP thymocytes of a 5 dpf embryo, immediately after photoconversion (00:00) and at 9 (00:09), 19 (00:19), and 66 (01:06) min thereafter. Representative results for four embryos. The highest average velocity over a 60 min observation period was 3.8 μm/min. Scale bars represent 50 μm. (B) Colonization of the kidney of ikaros:tdEosFP fish at 6 dpf after photoconversion of thymocytes at 5 dpf. The top panel (scale bar represents 100 μm) depicts a bright-image indicating the regions of the thymus (left panels underneath) and the kidney (right panels underneath). The fluorescent images depict, from top to bottom, the green, red, and combined channels; two double-positive cells in the kidney are marked by white circles. Representative results for 15 embryos. Scale bars represent 10 μm. |
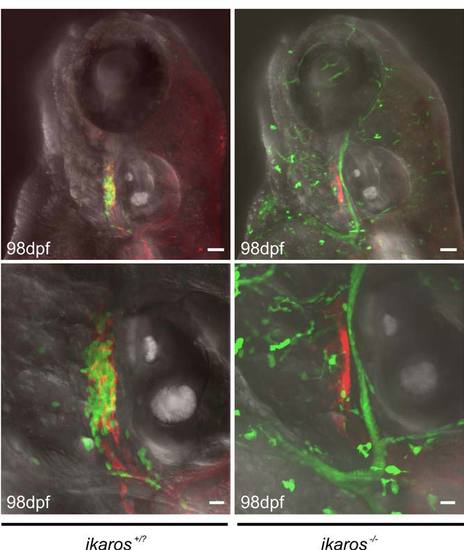
Initial colonization of the thymic rudiment in embryos depends on ikaros function Projected images of fish double-transgenic for ikaros:eGFP and foxn1:mCherry experiments constructs were obtained at 98 hpf. Representative wild-type (ikaros+/?; n=20) and ikaros-deficient (ikaros-/-; n=12) embryos are shown. The green cells seen in the images of the mutant embryos are motile myeloid cells, which do not reside in the thymus and hence do not obscure the view onto the thymic epithelial rudiment (red). For further details see Figure 2 and text. Scale bars, 50μm for upper, and 20μm for lower panels. PHENOTYPE:
|

Time and place of origin of thymus-settling precursors (A) Green fluorescent hematopoietic cells of fish transgenic for ikaros:tdEosFP were photoconverted in the indicated regions of the embryo (AGM, aorta-gonad-mesonephros; CHT, caudal hematopoietic tissue) at various time points (here shown for 36hpf); n=26 embryos for each time-point and region. Scale bars, 50μm. |

Expression domains of ccl25 and cxcl12 chemokine genes ÿShown are photographs of 3 dpf wild-type embryos subjected to WISH using gene specific probes. At the top, left images are lateral, right images are dorsal views of embryos. The bottom panels depict the entire embryo (composites of two [A], three [B,C] or four [D] original images). EXPRESSION / LABELING:
|

Chemokines regulate thymus homing Double-transgenic fish (ikaros:eGFP [green fluorescence]; foxn1:mCherry [red fluorescence]) were injected with gene-specific anti-sense morpholinos singly or in combination. The type of gene-specific morphant is indicated at the top of panels in the first column. The cxcl12b morphant exhibits a pre-thymic defect. See also Figure S6. PHENOTYPE:
|

Reduced numbers of ikaros-expressing cells in hematopoietic tissues in cxcl12b morphants ÿEmbryos double-transgenic for ikaros:eGFP and foxn1:mCherry were injected with a cxcl12b-specific anti-sense morpholino and assayed at 63 hpf for green cells in the AGM (aorta-gonad-mesonephros and CHT (caudal hematopoietic tissue) regions. Photographs representative of ~250 wild-type and 48 mutant embryos. Quantitative assessment (values shown are mean ± s.e.m.) revealed significant (Fisher´s exact probability test) reductions in both types of tissues. AGM: wild-type fish exhibit 8±0.58 (n=3) and cxcl12b morphants exhibit 0.75±0.25 (n=4) ikaros+ cells per high-power field (P<0.001); CHT: wild-type fish exhibit 32±3.5 (n=3) and cxcl12b morphants exhibit 8.5±1.3 (n=6) ikaros+ cells per high-power field (P<0.001). Anatomical landmarks are indicated: PCV, posterior cardinal vein; CV, caudal vein; CA, caudal artery; DA, dorsal aorta. Scale bars, 50μm. PHENOTYPE:
|
Reprinted from Immunity, 36(2), Hess, I., and Boehm, T., Intravital Imaging of Thymopoiesis Reveals Dynamic Lympho-Epithelial Interactions, 298-309, Copyright (2012) with permission from Elsevier. Full text @ Immunity