- Title
-
Discovering Small Molecules that Promote Cardiomyocyte Generation by Modulating Wnt Signaling
- Authors
- Ni, T.T., Rellinger, E.J., Mukherjee, A., Xie, S., Stephens, L., Thorne, C.A., Kim, K., Hu, J., Lee, E., Marnett, L., Hatzopoulos, A.K., and Zhong, T.P.
- Source
- Full text @ Chem. Biol.
|
Cardionogen Increases Heart Size during Zebrafish Development (A) Chemical structures of the Cardionogen family, including CDNG1/vuc230, CDNG2/vuc198, and CDNG3/vuc247. (B–F) Fluorescent optics displaying untreated control heart (CTL) (B), CDNG1-treated heart (C), CDNG2-treated heart (D), untreated control embryo (CTL) (E), and CDNG1-treated embryo (F) in Tg[cmlc2:EGFP] embryos at 60 hpf. (G and H) Light optics showing control embryos (CTL) (G) and CDNG1-treated embryos (H) at 60 hpf. (B–D) Ventral view; (E–H) lateral view. Red arrow, ventricle; blue arrow, atrium. CDNG1 treatment (30 μM, 5 to 60 hpf). |
|
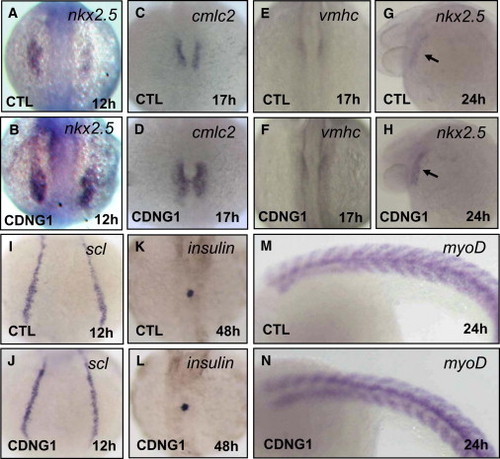
Cardionogen Promotes Expansion of the Cardiac Progenitor Cell Population Expression of nkx2.5 (A and B), cmlc2 (C and D), vmhc (E and F), nkx2.5 (G and H), scl (I and J), insulin (K and L), and myoD (M and N) in CDNG1-treated and control embryos was examined using in situ hybridization. Expression of nkx2.5 [39 of 43 embryos in (A) and (B)], cmlc2 [42 of 47 embryos in (C) and (D)], vmhc [41 of 45 embryos in (E) and (F)], and nkx2.5 [38 of 41 embryos in (G) and (H)] is increased. Expression of scl (41 of 43 embryos), insulin (42 of 45 embryos), and myoD (39 of 42 embryos) is not altered. Images were taken at 12 hpf (A, B, I, and J), 17 hpf (C–F), 24 hpf (G, H, M, and N), and 48 hpf (K and L). Dorsal (A–F and I–L) and lateral views (G, H, M, and N) are shown. CTL, control; black arrow, heart tube. CDNG1, 30 μM. |
|
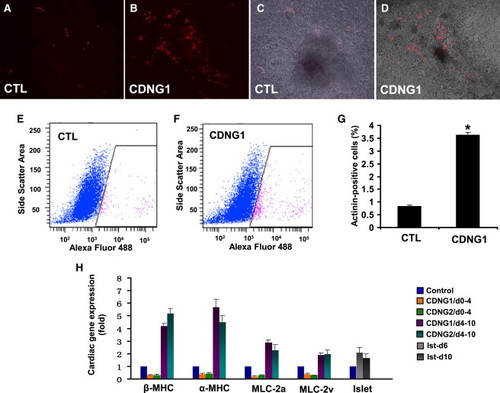
Cardionogen Induces Murine ES Cells to Differentiate into Cardiomyocytes (A and B) Fluorescent optics revealing myocardial differentiation (red areas) in 0.1% DMSO-treated (CTL) and 1 μM CDNG1-treated CGR8-ES cells (Tg[αMHC:DsRed-nuc]). (C and D) Bright-field pictures merged with fluorescent images of control (A) and CDNG1-treated cells (B). (E and F) Flow-cytometry analyses revealing the fraction of ES cells expressing αMHC:DsRed-nuc in 0.1% DMSO-treated and CDNG1-treated ES cells. The x axis is the intensity of Alexa Fluor 488 immunostaining; the y axis is the side scatter area. (G) Analysis of sarcomeric α-actinin by flow cytometry indicates that CDNG1 treatment enhances cardiomyocyte content 4.36-fold (from 0.83 ± 0.06% to 3.62 ± 0.09%). GCR8-ES cells were treated with 0.1% DMSO and 1 μM CDNG1 from day 4 to day 10 and analyzed at day 12. (H) Bar chart depicting relative expression folds of βMHC, αMHC, MLC-2a, MLC-2v, and islet in 1 μM CDNG1- and CDNG2-treated ES cells, compared to 0.1% DMSO-treated controls. βMHC, αMHC, MLC-2a, and MLC-2v were examined at day 12; islet was examined at days 6 and 10. GAPDH was used as internal controls for normalization. CTL values were arbitrarily set to 1. Graphs (G and H) show mean ± s.d., performed in triplicate; *p < 0.01 compared with control. See also Movies S1 and S2. |
|
Cardionogen Inhibits Wnt3a/β-Catenin-Mediated Transcription (A) Cardionogen-1 inhibits Wnt3a-induced TOPflash activity in ES cells. CGR8-ES cells were treated with Wnt3a (100 ng/ml)-conditioned media plus CDNG1 or IWR1 compounds in a series of concentrations. Dose-response curves represent TOPflash activities normalized to cell number (mean ± s.d.; performed in quadruplicate). The calculated EC50 values for Cardionogen-1 and IWR1 are 23 nM and 7.5 nM, respectively. Graphs were made in Prism 4 (GraphPad Software) with nonlinear regression fit to a sigmoidal dose-response curve. (B) Cardionogen does not inhibit Lef/Tcf transcription that is independent of β-catenin activity. CGR8-ES cells were transfected with ΔNLef-VP16 and treated with 1 μM Cardionogen-1 or 1 μM IWR1. Graph represents TOPflash activities (mean ± s.d.; performed in triplicate). (C) Cardionogen inhibits LRP6-mediated Wnt signaling. CGR8-ES cells were transfected with a constitutively active LRP6ICD and treated with 1 μM Cardionogen-1, 1 μM IWR1, or 0.1% DMSO (CTL). TOPflash activity is graphed (mean ± s.d; performed in triplicate; *p < 0.01). (D) Bar chart showing relative expression fold of BMP4-induced Id2 expression ([Hua et al., 2006] and [Nakahiro et al., 2010]) in the presence of CDNG1, BMP4, BMP4+CDNG1, BMP4+DM, compared to its expression in 0.1% DMSO (CTL). Concentrations were 30 ng/ml for Bmp4, 1 μM for CDNG1, and 1 μM for DM. Id2 expression normalized to GAPDH is graphed (mean ± s.d; performed in triplicate; *p < 0.01). CTL values were arbitrarily set to 1. (E–J) Images taken at 24 hpf (see also Figures S2 and S3). Red arrows indicate GFP expression. (E and F) Fluorescent optics revealing GFP fluorescence in the midbrain in Tg(TOP:GFP) embryos [outlined area enlarged in (F)]. (G and H) CDNG1 treatment (30 μM; 5–24 hpf) reduces GFP fluorescence in the midbrain of Tg(TOP:GFP) embryos [outlined area enlarged in (H)]. (I and J) IWR1 treatment (30 µM; 5–24 hpf) eliminates GFP fluorescence in the midbrain of Tg(TOP:GFP) embryos [outlined area enlarged in (J)]. |
|
Cardionogen Rescues Wnt8-Induced Cardiac Phenotypes (A–C) cmlc2 expression in non-heat-shocked embryos (A), heat-shocked embryos (B), and CDNG1-treated heat-shocked embryos (C). Of 25 embryos, 23 were rescued. (D–F) Rescue of heart formation labeled by cmlc2 expression in CDNG1-treated heat-shocked embryos (F) compared to heat-shocked embryos (E) and non-heat-shocked embryos (D). Of 26 embryos, 25 were rescued. (G–I) Inhibition of cardiac expansion labeled by cmlc2 expression in CDNG1-treated heat-shocked embryos (I), compared to heat-shocked embryos (H) and non-heat-shocked embryos (G). Of 24 embryos, 21 were inhibited. Heat shock was administered at 38.5°C for 15 min at 3 hpf (H and I) and 9 hpf (B, C, E, and F). Black arrow, cardiomyocytes; red arrow, ventricle; blue arrow, atrium. |
|
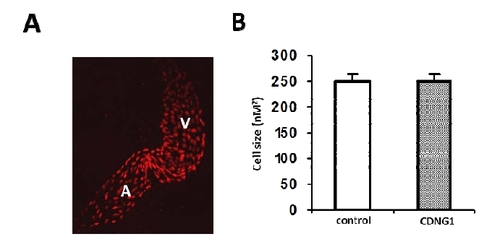
related to Figure 3: Cardiac cell size is not altered in CDNG1-treated embryos. (A) Fluorescent optics exhibiting individual nuclei of cardiomycoytes in flat-mounted Tg(cmlc2:DsRed-nuc) embryos (60hpf). (B) Cardiac cell size is comparable in embryos treated by CDNG1 at 30μM (5-60 hpf) compared to control embryos. 20 cardiomyocytes were chosen from 3 treated and untreated embryos for cell size analysis. Graph shows mean ±s.d. |
|
related to Figure 6: IWR1 treatment causes defects in zebrafish embryo and heart development. (A) Lateral view displaying a wild-type embryo with a normal body length. (B) Embryos treated with IWR1 exhibiting tail truncation in loosing tail structure posterior to the yolk extension. (C, D) In situ hybridization analyses revealed normal nkx2.5 expression in a wild-type embryo and increased nkx2.5 expression in a IWR1-treated embryo. (E, F) Dorsal views displaying the normal cmlc2 expression in a wild-type embryo and increased cmlc2 expression in a IWR1-treated embryo. (G, H) Fluorescent optics in lateral views exhibiting a normal atrium and a normal ventricle in a wild-type Tg(cmlc2:EGFP) embryo and defective cardiac chambers in a IWR1-treated Tg(cmlc2:EGFP) embryo. (I, J) cmlc2 expression in ventral views revealing a normal atrium and ventricle in a wild-type embryo and defective cardiac chambers in a IWR1-treated embryo. (K, L) vmhc expression in ventral views showing a normal ventricle in a wild-type embryo and a defective ventricle in a IWR1-treated embryo. (M, N) amhc expression in ventral views exhibiting a normal atrium in a wild-type embryo, and bilateral-aligned atrial myocytes (red arrows) in a IWR1-treated embryo, leading to failure to form the atrium. a: atrium; v: ventricle; IWR1: 20 μM. 12 hpf (C, D); 17 hpf (E, F); 24 hpf (A, B); 48 hpf (G-N). |


