
- Title
-
Regenerative response following stab injury in the adult zebrafish telencephalon
- Authors
- März, M., Schmidt, R., Rastegar, S., and Strähle, U.
- Source
- Full text @ Dev. Dyn.

Stab injury of the telencephalon leads to up-regulation of GFAP-GFP and swelling of radial glial processes. All views of this and following figures are transverse sections through the telencephalon, stained with the markers indicated (color-coded). Inserts indicate rostro-caudal positions. Lesioned telencephalic hemispheres are always located to the left. A–F: Brightfield images of cross-sections through lesioned areas. Boxes indicate lesion (A,C,E). Immunostaining against GFP in the Tg(GFAP-GFP) transgenic line at different time-points after injury (B,D,F). A slight up-regulation can be detected at 3 dpl (C,D), which is increased at 14 dpl (E,F). Boxes indicate region of injury. G: Measurement of GFAP-GFP fluorescent signal intensity using ImageJ and calculating the fold-change between injured and uninjured hemisphere shows increasing GFAP-GFP intensity from 3 dpl until 14 dpl. H: Quantification of S100B positive cells comparing lesioned to unlesioned hemispheres at different time points post lesion. There is no significant change in S100B positive cells until 14 dpl, when an increase in S100B cells can be observed. Scale bar = 100 μm in A–F. |

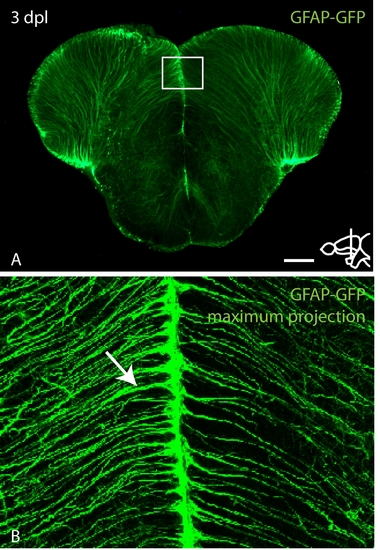
GFAP-GFP positive radial glial fibers exhibit hypertrophic swellings in response to stab injury. A: Overview of a GFAP-GFP brain section through the lesioned area. Boxes indicate regions shown in higher magnification in B, C (left box) and D, E (right box). B,C: High magnification of the boxed region in A, with arrows indicating that cell body-like swellings do not co-stain with the nuclear marker Draq5 (C), suggesting that they are not parenchymal GFAP-GFP positive cells (B is an average projection of the confocal Z-stack to illustrate fiber morphology). D,E: No hypertrophic swelling can be found in the unlesioned hemisphere, suggesting a reaction specific to injury (D is an average projection of the confocal Z-stack to illustrate fiber morphology). Scale bar = 100 μm in A; 7.5 μm in B–E. |
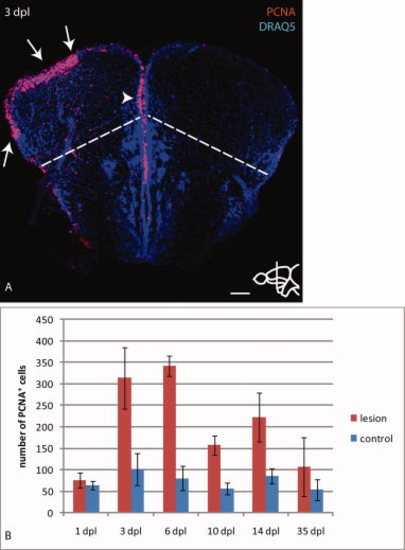
Stab injury leads to up-regulation of PCNA in the lesioned hemisphere. A: Immunostaining for the proliferation marker PCNA combined with a nuclear stain (Draq5) at 3 dpl. Arrows indicate up-regulation of PCNA at the ventricle of the lesioned hemisphere, mainly restricted to the pallium delineated by a dashed line. The arrowhead indicates proliferating cells at the dorso-medial ventricle of the lesioned hemisphere closely adjacent to the control hemisphere. B: Quantification of PCNA positive cells at the pallial ventricle of the lesioned hemisphere compared with the control hemisphere shows normal proliferation levels at 1 dpl, a peak of proliferation at the lesioned side between 3 and 6 dpl and significantly increased levels until at least 14 dpl. At 35 dpl PCNA levels are comparable between lesioned and control hemispheres. n=5 telencephala per time-point. Error bars indicate standard deviation. Scale bar = 100 μm in A. |
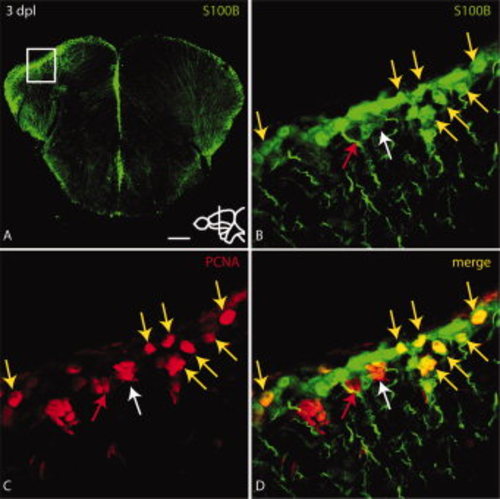
Some proliferating cells at the ventricle of the lesioned hemisphere express the radial glial marker S100B. A: Overview of a section through the site of injury. The injured hemisphere (to the left) expresses higher levels of S100B and PCNA (see Fig. 3A). B–D: High magnification view of boxed region in A. PCNA positive cells co-express S100B (yellow arrows in B–D). Some clusters of PCNA positive cells express only weak levels of S100B (white arrow in B–D) or no S100B (red arrow in B–D). Scale bar = 100 μm in A; 10 μm in B–D. |
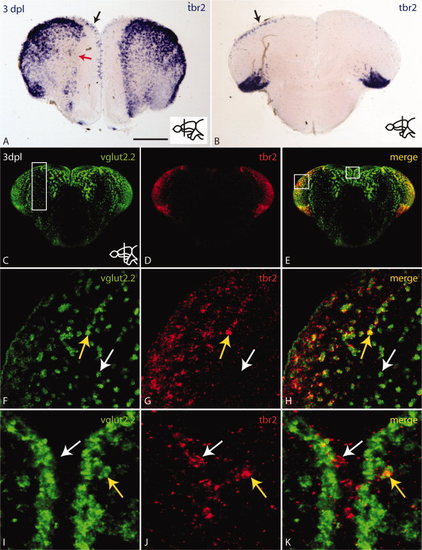
The number of tbr2 positive cells is increased in the injured hemisphere in response to stab injury. A,B: In situ hybridization with tbr2 antisense probe on cross-sections shows an increase of tbr2 expressing cells in the injured hemisphere at anterior (A) and posterior levels (B) (black arrows). Red arrow in A indicates loss of tbr2 expression probably due to the loss of neurons as a result of the lesion. C–E: Overview of double fluorescent in situ hybridization for vglut2.2 (C) and tbr2 (D) and merged channels (E) at 3 dpl. tbr2 and vglut2.2 are co-expressed in the dorsolateral pallium. White box in C indicates region of injury. White boxes in E indicate high magnification views in F–H (left box) and I–K (middle box). F–H: High magnification of the left box in E. The yellow arrow indicates co-expression of vglut2.2 and tbr2 whereas the white arrow points to a vglut2.2-positive/tbr2-negative cell. I–K: High magnification of the middle box in E. The yellow arrow indicates co-expression of vglut2.2 and tbr2 in a subventricular location whereas the white arrow points to a tbr2-positive/vglut2.2-negative cell at the ventricle. tbr2 is expressed in a subpopulation of glutamatergic neurons and potential glutamatergic progenitor cells at the ventricle. Scale bar = 100 μm in A,B; 150 μm in C–E; 30 μm in F–H; 15 μm in I–K. |
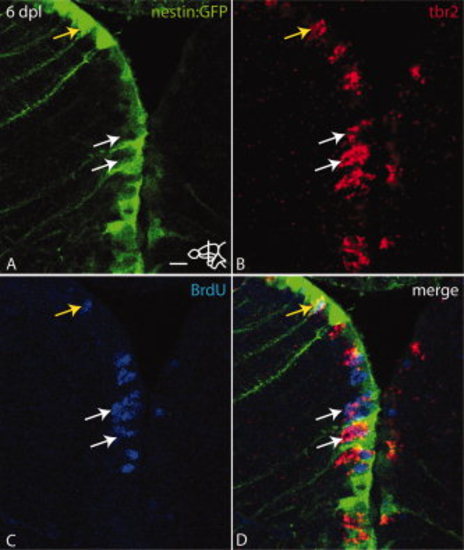
At 6 dpl tbr2 positive cells are located intercalated between nestin:GFP radial glial cells and originated partly from progenitors that were in S-phase at 3 dpl. Bromodeoxyuridine (BrdU) was injected at 3 dpl followed by a chase until 6 dpl. A: Expression of nestin:GFP at 6 dpl. Note the up-regulation of nestin:GFP in the left hemisphere. B: Expression of tbr2 mRNA (arrows). C: BrdU incorporation (white arrows). D: Overlay of A–C. White arrows indicate tbr2 expressing cells positive for BrdU. These cells are intercalated between nestin:GFP positive cells. Yellow arrow shows a nestin:GFP cell also positive for tbr2 and BrdU. Scale bar = 10 μm. |
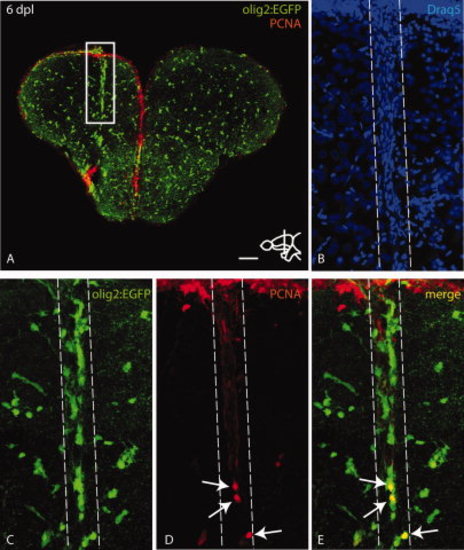
Stab injury leads to clustering of olig2:EGFP cells at the site of injury with a moderate proliferative response. A: Overview of a telencephalic cross-section through the injured region stained with anti-GFP and anti-PCNA antibodies at 6 dpl. The white box indicates olig2:EGFP cells clustering around the lesion. B–E: High magnification view of boxed region in A as maximum projection of a confocal Z-stack. The lesioned area is indicated by dashed lines. Draq5 staining in B shows the lesion filled with blood cells. Pictures in C–E show clustering of olig2:EGFP cells around the lesion (C, E) and a subpopulation of cells that is positive for proliferation nuclear antigen (PCNA) (arrows in D,E). Scale bar = 100 μm in A; 20 μm in B–E. |
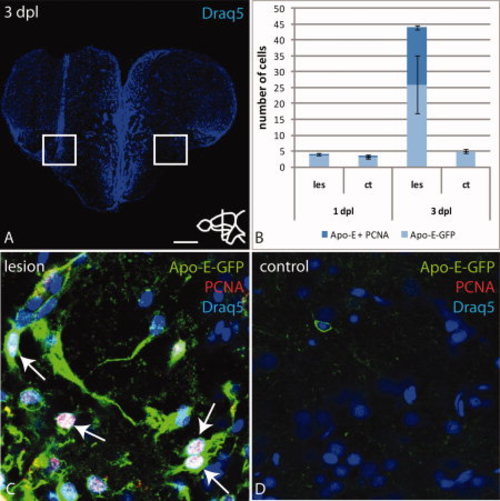
Apo-E-GFP positive microglia cells proliferate in the parenchyma in response to wounding. A: Overview of a telencephalic cross-section through the lesioned region stained with Draq5. White box marks the ventral part of the lesion. B: Quantification of microglia cells labeled with Apo-E-GFP or together with PCNA. A subset of Apo-E-GFP microglia is proliferation-competent at 3 dpl. C,D: High magnification of the boxed region in A. Overlay of Apo-E-GFP, PCNA and Draq5 (C). Colocalization of PCNA and Apo-E-GFP shows that microglia proliferate near the lesion (arrows C). Scale bar = 100 μm in A; 7.5 μm in B–E. |
Increased expression of GFAP-GFP in the lesioned hemisphere after stab injury. A: Overview of a section through the lesioned area in a GFAP-GFP transgenic fish. Boxed region is shown in high magnification in (B). B: High magnification maximum projection of the medial ventricle. Lesioned hemisphere to the left. Arrow indicates stronger expression of GFAP-GFP in the lesioned hemisphere. Scale bar = 100 μm in A; 17.5 μm in B. |
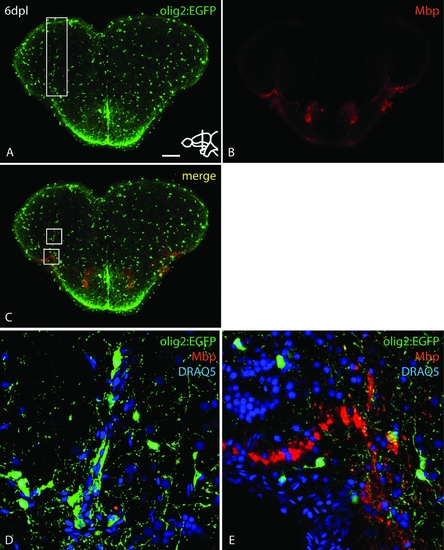
olig2:EGFP positive cells that cluster at the site of lesion after injury are mainly oligodendrocyte progenitor cells (OPCs). A: Overview of a section through the lesioned area in a olig2:EGFP transgenic brain. White box indicates stab injury and clustered olig2:EGFP positive cells. B: Antibody staining against Mbp, a mature oligodendrocyte marker. C: Merged pictures of A and B. White boxes are shown in high magnification in D (top box) and E (lower box). No colocalization of olig2:EGFP and Mbp could be observed in the cluster around the lesion (D). Scale bar = 100 μm in A; 15 μm in D–E. |

Stab injury leads to clustering of olig2:EGFP cells at the site of injury. A: Immunostaining against GFP in the olig2:EGFP transgenic line shows clustering of olig2:EGFP cells at the lesion (white box in A). B: Quantification of olig2:EGFP positive cells in the pallium of the lesioned hemisphere compared with the control hemisphere shows comparable total numbers of olig2:EGFP positive cells. This suggests that there is no up-regulation of olig2:EGFP in the injured hemisphere and clustering of cells may be due to cell migration. n = 5 telencephala per time-point. Error bars indicate standard deviation. Scale bar = 100 μm in A. |