
- Title
-
Regeneration of the adult zebrafish brain from neurogenic radial glia-type progenitors
- Authors
- Kroehne, V., Freudenreich, D., Hans, S., Kaslin, J., and Brand, M.
- Source
- Full text @ Development
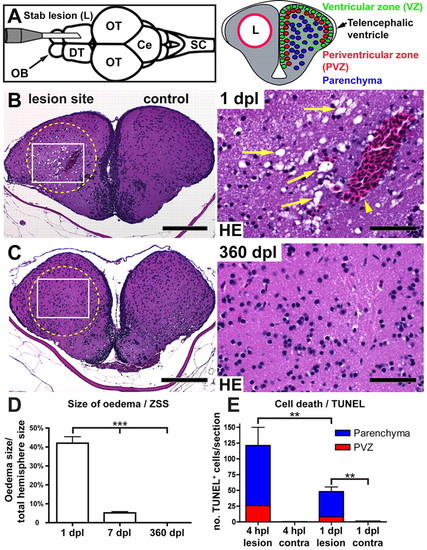
The stab lesion assay and restoration of tissue integrity of the adult telencephalon. (A) Insertion of a canula into the telencephalon of an adult zebrafish causes a lesion canal (L) in parallel to the rostrocaudal body axis along one hemisphere (dorsal view; OB, olfactory bulb; DT, dorsal telencephalon; OT, optic tectum: Ce, cerebellum; SC, spinal cord). In cross-sections (right), three layers can be functionally distinguished in DT: contacting the ventricle is the neural progenitor containing ventricular zone (VZ, green). During constitutive neurogenesis, all newborn neurons integrate into the periventricular zone (PVZ, red, one or two cell diameters adjacent to the VZ). The uninjured central parenchyma (blue) does not receive new neurons. (B) Tissue within the stab canal is strongly vacuolated (arrows), and often contains a prominent blood clot (arrowhead) as seen in Haematoxylin/Eosin (HE) stained sections 1 day post lesion (dpl). (C) Complete morphological restoration of the tissue architecture is seen by 360 dpl. Scale bars: 200 μm in B,C overviews; 50 μm in B,C insets. Circles indicate the lesion canal. (D) Quantification of the size of the vacuolated zona status spongiosus (ZSS) at 1, 7 and 360 dpl (n=3, n=4 and n=3, respectively). (E) Quantification of TUNEL+ cells at 4 hours post lesion (hpl) (n=3) and at 1 dpl (n=4). Data are mean+s.e.m. ***Pd0.001; **Pd0.01. |
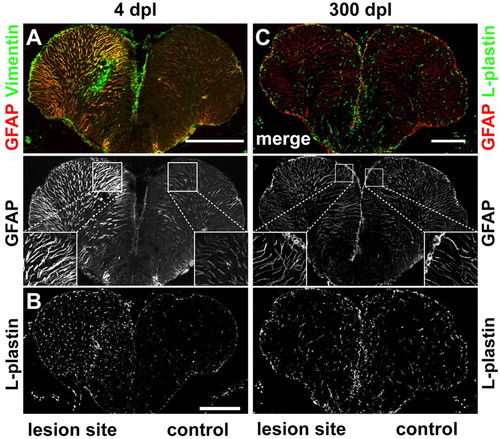
Reactive gliosis, inflammatory response and scarring. (A) The glial markers GFAP (red) and vimentin (green) are strongly upregulated in the lesioned hemisphere early after injury (4 dpl). GFAP+ radial fibres in the lesioned hemisphere are thicker compared with the control hemisphere. (B) The pan-leukocyte marker L-plastin is strongly upregulated in the lesioned hemisphere at 4 dpl. (C) No difference in number and appearance of GFAP+ (red) radial processes is detected comparing lesioned and control hemispheres 300 dpl. Staining for L-plastin (green) shows no difference in the number and distribution of leukocytes between the lesioned and the control hemisphere. Scale bars: 200 μm. |
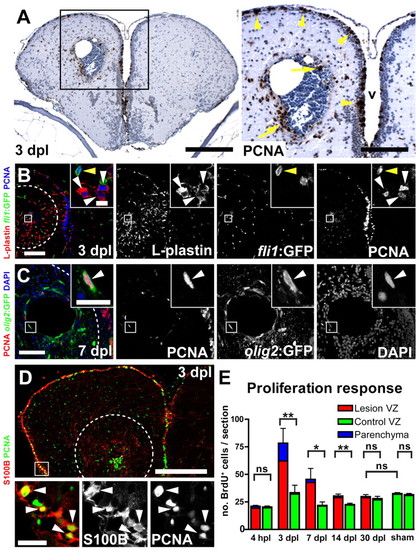
Reactive proliferation. (A) Many mitotic, PCNA+ (brown) cells are detected close to the lesion (3 dpl) in the parenchyma (arrows), as well as in the VZ (arrowheads). In the contralateral hemisphere, fewer PCNA+ cells are detected in the VZ and only very few in the parenchyma (v, ventricle). Nuclei are counterstained with Nissl (blue). (B) Using a pan-leukocyte marker (L-plastin, red) combined with PCNA (blue) identifies leukocytes as the major proliferating cell population in the parenchyma (white arrowheads). PCNA+ endothelial cells are also found in the parenchyma (yellow arrowhead), as shown by analysis for fli1:GFP expression (green). (C) Olig2:GFP+ (green) oligodendrocyte-precursor cells are ectopically proliferating (PCNA, red, arrowhead) in the parenchyma. (D) S100B+ (red) radial glia increase proliferation (PCNA, green, arrowheads) within the VZ in lesioned hemispheres. Broken outlines represent the lesion canal. Scale bars: 200 μm in A, inset 100 μm; 100 μm in B, inset 10 μm; 50 μm in C, inset 10 μm; 200 μm in D, inset 20 μm. (E) Quantification of the number of BrdU+ cells (2 hours BrdU pulse) shows a significant upregulation of the total number of proliferating cells in the lesioned (red bars) versus the control hemisphere (green bars) at 3, 7 and 14 dpl (n=5, n=4 and n=5, respectively). At 4 hpl and at 30 dpl, no significant difference is detected between lesioned, contralateral and sham-operated hemispheres (n=3, n=4 and n=3, respectively). At 3 dpl, reactive proliferation reaches its peak, and the majority of mitotic cells are located within the VZ (79.5%±14.8%, red). Data are mean+s.e.m. **Pd0.01; *Pd0.05. |

Reactive neurogenesis leads to many long-lived, newly generated neurons. (A) 4 dpl newborn BrdU+(green)/HuC/D+(red) neuroblasts, generated at the time of the radial glia proliferation peak (BrdU pulse 48-92 hpl), are leaving the VZ and migrate towards the lesion site. Note the prominent leading edge profile (arrowhead), a typical feature of migrating neuroblasts. (B) Newborn BrdU+/HuC/D+ neurons that were born between 4 and 16 dpl can be found close to the lesion site in the parenchyma 21 dpl (arrowheads). (C) Many of these injury-induced ectopic neurons survive for at least 90 dpl close to the lesion site deep in the parenchyma, as well as in the PVZ, as shown by BrdU/HuC/D double staining (arrowheads). Scale bars: 100 μm in A-C; 10 μm in insets. (D) Quantification of BrdU+/HuC/D+ cells shows a significant net gain of newly generated neurons in the lesioned hemisphere at 21 (n=5) and 90 dpl (n=3). Data are mean+s.e.m. **Pd0.01; *Pd0.05. |

Newly generated neurons derive from a her4.1-expressing radial glia-type progenitor. (A) Generation of double-transgenic fish used for cell fate analysis: fish expressing CreERT2 controlled by the her4.1-promotor were crossed to red-to-green reporter fish. In double-transgenics, GFP expression can be specifically induced in her4.1-expressing radial glia and their progeny by tamoxifen application and heat shock. (B) Recombination was induced specifically in her4.1-expressing radial glia by tamoxifen injection 1 day before lesion. Fish (18 to 21 dpl) were heat-shocked to induce GFP expression in recombined cells only. (C) Cre-recombinase expression is restricted to radial glia in the adult telencephalon of Tg(her4.1:mCherryT2ACreERT2) fish: the expression of mCherry (red) is restricted to ventricular cells that resemble radial glia by morphology. Cre mRNA expression (blue) is restricted to the VZ, as shown by in situ hybridization. her4.1:mCherry is expressed in ventricular cells that co-express glutamine synthetase (GS, green), identifying them as radial glia. (D) By 21 dpl, many recombined GFP+(green)/HuC/D+(red) neurons/neuroblasts (arrowheads) are found within the lesion-canal (yellow outline) and in the PVZ (white outline). In the VZ recombined GFP+/HuC/D– cells with radial processes, i.e. radial glia (arrow), are found. (E) Recombined neurons (arrowheads) derived from her4.1+ radial glia (arrow) are exclusively found in the PVZ in the dorsal part of unlesioned control hemispheres 21 dpl. Scale bars: 200 μm in C overviews, inset 10 μm; 100 μm in D, inset 50 μm; 100 μm in E, inset 10 μm. v, ventricle; l, lesioned hemisphere; c, control hemisphere. (F) Quantification of cell fate analysis 21 dpl (n=7). The number of recombined GFP+/HuC/D– ventricular radial glia is not significantly different in lesioned and control hemispheres. However, the number of lineage-traced neurons is significantly increased in the lesioned hemisphere, showing that radial glia in the lesioned hemisphere produce more neurons and, in particular, give rise to neurons that migrated into the parenchyma. Data are mean+s.e.m. *Pd0.01. |

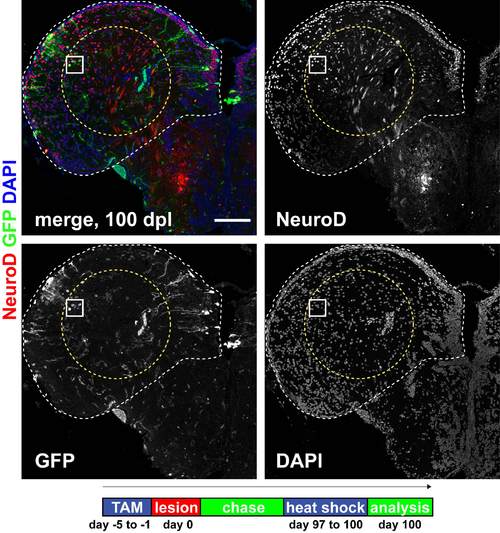
Radial glia-derived neurons are maintained long term, show a correct regional identity and display features of mature functional neurons. (A) Many recombined GFP+(green)/HuC/D+(red) neurons (arrowheads) are maintained in the parenchyma and in the PVZ until 100 dpl. (B-G) Examples of radial glia-derived (GFP+, green) neurons in the dorsal parenchyma that express: (B) the dorsal marker NeuroD1 (arrowheads, red) at 100 dpl; (C) the mature interneuron and regional marker parvalbumin (arrowheads, PVA, red) at 21 dpl; (D) the regional marker Prox1 (arrowhead, red) at 100 dpl; (E) the mature neuronal marker MAP2a+b (arrowhead, MAP2, red) at 53 dpl; (F) the synaptic vesicle marker SV2 (arrowheads, SV2, red) at 53 dpl; and (G) the synaptic marker metabotropic glutamate receptor 2 (arrowheads, mGlu2, red) at 100 dpl. Scale bars: 100 μm in A overview; 10 μm in A inset; in 10 μm in B-G. v, ventricle. Timeline shows experimental procedures. |
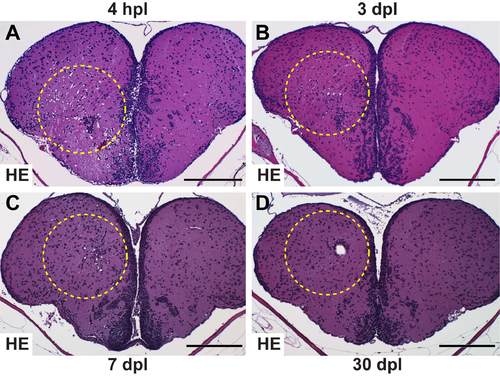
Timecourse of status spongiosus and re-establishment of tissue integrity. (A) At 4 hpl the majority of the cross-sectional area of the lesioned hemisphere has the typical sieve-like structure known as status spongiosus. In addition, tissue outside the stab canal shows a spongious phenotype due to oedema. (B) By 3 dpl, the vacuolated area is dramatically reduced in size compared with at 4 hpl (A). The size of the vacuoles is strongly reduced compared with 1 dpl (Fig. 1B). (C) The oedema size and the degree of vacuolisation is further decreased at 7 dpl compared with 3 dpl. (D) The oedema size is further reduced at 30 dpl. Often a single small hole is seen. Scale bars: 200 μm. All panels show HE stains of 1 μm paraffin sections. Dashed outlines represent the lesion canal. |

Neuronal processes get destroyed by the stab lesion, but are re-established 360 dpl. (A) Thick lateral axon bundles (arrowheads) are largely destroyed by the stab lesion, as seen in Bodian silver stainings of neuronal processes 1 dpl. (B) Already by 14 dpl neuronal processes re-appear within the lesion site (arrowheads), although the number and extent is still reduced compared with unlesioned telencephali. (C) By 360 dpl the number and thickness of the axon bundles is indistinguishable between lesioned (dashed circle) and unlesioned hemispheres (compare with A). Scale bars: 200 μm in A (low magnification); 100 μm in A (middle magnifications); 50 μm in A (high magnifications); 100 μm in B and C. All panels show 1 μm paraffin sections. Dashed outlines represent the lesion canal. |
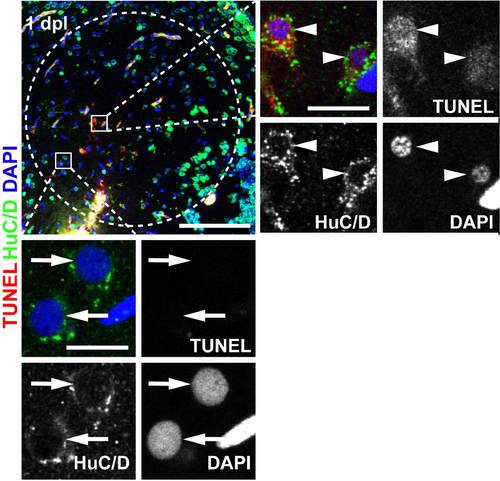
Neurons within the lesioned hemisphere enter cell death rapidly after lesion. TUNEL+ (red)/HuC/D+ (green) double-positive, dying neurons (arrowheads) are found in the lesioned parenchyma (right inset panel) at 1 dpl. Most dying cells show hallmarks of apoptosis, like cytoplasmic condensation and condensed pycnotic nuclei (DAPI, blue, compare dimensions with TUNEL-, not dying neurons, shown in the inset panel below) and also characteristics of necrosis, such as nuclear and cytoplasmic TUNEL signal. Note also the spotty and weak HuC/D-signal that is a hallmark of damaged neurons. Insets show single confocal sections. Scale bars: 100 μm and 10 μm in insets respectively. Dashed outline represents the lesion canal. |
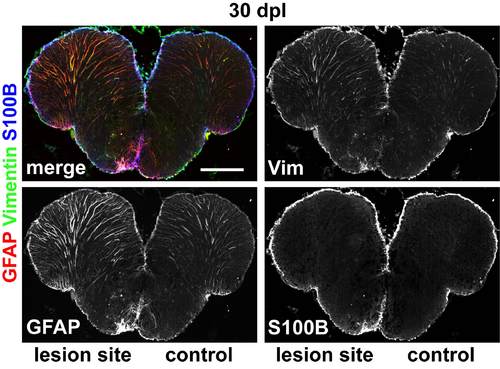
Glial markers are still upregulated in the lesioned hemisphere at 30 dpl. The glial markers GFAP (red) and vimentin (green) are markedly upregulated in the VZ and in radial processes of the lesioned hemisphere 30 dpl. The ependymo/glial marker S100B (blue) is only slightly upregulated in the VZ of the lesioned hemisphere. Scale bar: 200 μm. |
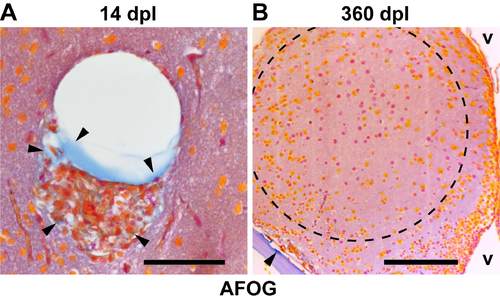
Collagen transiently accumulates at the lesion site. (A) 14 dpl cells at the lesion site are associated with ectopic extracellular matrix (arrowheads, collagen, blue), as seen in Acid-Fuchsin-OrangeG (AFOG) stained 1 µm paraffin sections. (B) At 360 dpl, no ectopic accumulation of collagen is seen in the lesioned hemisphere, indicating absence of fibrotic scar tissue. The collagen-containing bone of the skull (floor plate) is clearly stained blue (arrowhead). v, ventricle. Scale bars: 50 μm in A; 100 μm in B. Dashed outline represents the lesion canal. |

A small confined glial inclusion is remaining in stab lesioned hemispheres after long survival times. (A) At 360 dpl in two out of three fish a 30×40×30 μm3 cyst is seen in the caudal dorsal telencephalon in HE-stained 1 µm paraffin sections that may be a remnant of the previously much larger lesion canal that has otherwise closed. (B) Acid-Fuchsin/OrangeG staining (AFOG) shows extracellular matrix (arrowheads, collagen,blue) deposition within the remnant 360 dpl. (C) Neuronal processes can be detected around and within (arrowhead) the glial inclusion by Bodian silver staining 360 dpl. (D) At 150 dpl, the inclusion consists of cells that are weakly positive for GFAP (red) and strongly express S100B (green), identifying their glial/ependymal character (nuclei, DAI, blue), as shown in single confocal sections. Scale bars: 200 μm in A, 50 μm in inset; 50 μm in B,C; 10 μm in D. The dashed outline represents the lesion canal. |

Most cells proliferating in the parenchyma are leukocytes. (A) At 3 dpl a sub-population of PCNA+ (blue), proliferating cells are found within and close to the lesion canal in the parenchyma. In the same area many ectopic L-plastin+ leukocytes (red) are located (see also Fig. 2B for comparison with the control hemisphere). Single confocal sections (inset) of 14 μm cryosections show that the great majority of PCNA+ nuclei in the parenchyma belong to L-plastin+ leukocytes (white arrowheads). Only a few PCNA+ nuclei are located within fli1-EGFP+ endothelial cells (green, yellow arrowheads). (B) 7 dpl olig2+:GFP OPCs (green) in the parenchyma are found to express PCNA (red, arrowheads), but many more proliferating cells in the parenchyma do not express olig2: GFP(arrows), as shown in single confocal sections. Scale bars: 100 μm in A, 50 μm in inset; 100 μm in B. Dashed outlines represent the lesion canal. |
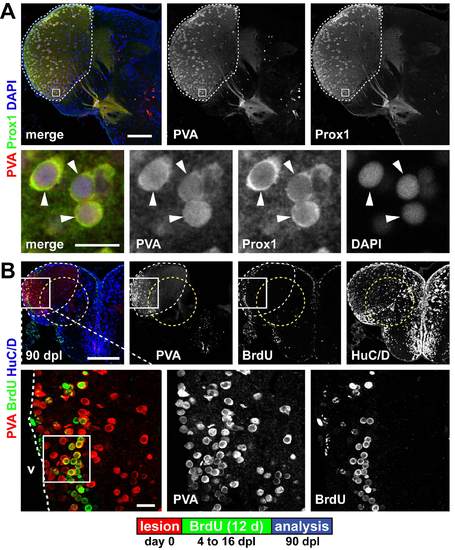
Parvalbumin and Prox1 expression mark a territory within the lesion site in the dorsolateral telencephalon. (A) A territory in the dorsolateral telencephalon is characterized by the co-expression of the interneuron marker parvalbumin (PVA, red) and Prox1 (green) in a neuronal subpopulation (white dashed outline). Co-expression (arrowheads) is shown in a single confocal section. (B) The PVA/Prox1 territory (white dashed outline) is further characterized by weak expression of HuC/D (blue) and reaches into the lesion canal (yellow dashed circle). When BrdU is applied 4 to 16 dpl to label newborn cells, many periventricular PVA+ (red)/BrdU+ (green) are found at 90 dpl within the dorsolateral telencephalon, as shown in confocal max projections. This shows that the lesion does not alter the fate of newborn neurons: they acquire a spatially appropriate neuronal subtype. The area framed in the inset indicates the location of the single confocal section displayed in Fig. 5A. Scale bars: 200 μm; 50 μm in inset. |
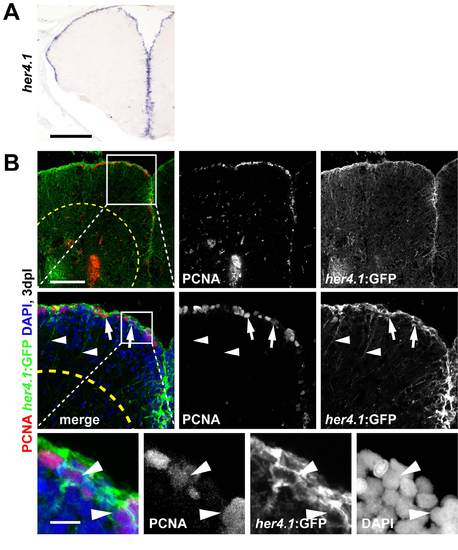
her4.1 is expressed by radial glia showing reactive proliferation after stab lesion. These cells can be lineage traced using tg(her4.1:mcherryT2ACreERT2) transgenic fish. (A) her4.1 is expressed along the whole extent of the ventricular proliferation zone of the telencephalon, as shown by in situ hybridisation. (B) her4.1-expressing radial glia in the VZ react to lesion and re-enter the cell cycle. After stab lesion, tg(her4.1:EGFP) transgenic fish many nuclei of EGFP+ (GFP) cells (green) co-localize with PCNA (red, arrows) 3 dpl, as shown in single confocal sections (high magnification inset). Note that EGFP expression in this line highly mimics radial glia morphology (radial processes, arrowheads). Scale bars: 200 μm in A; 100 μm in B, 10 μm in inset (high magnification). Dashed outlines represent the lesion. |
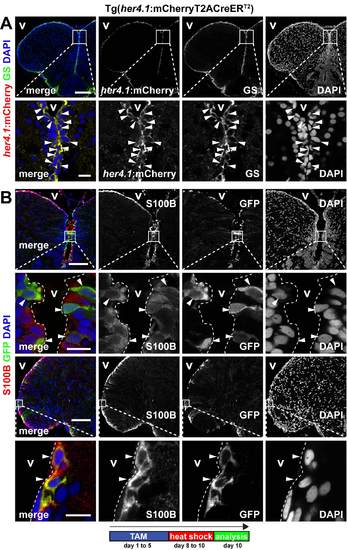
Cre expression is restricted to radial glia in the adult zebrafish telencephalon in the her4.1:mCherryT2ACreERT2 line. (A) In the adult telencephalon of transgenic (her4.1:mCherryT2ACreERT2) fish, the expression of mCherry (red) is restricted to cells in the VZ that co-express the glial marker glutamine synthetase (GS, green, arrowheads), identifying them as radial glia. (B) To identify the cell type in which tamoxifen-dependent recombination occurs at the initial stages of lineage-tracing experiments analysis for the glial marker S100B and GFP were carried out using double transgenic her4.1:mCherryT2ACreERT2 × hsp70:DsRed2(floxed)EGFP fish. Recombination was induced by five tamoxifen soakings and fish were analyzed 10 days after the first soaking. GFP expression (green) is restricted to the VZ and all cells also express S100B (red, arrowheads). Thus, tamoxifen-dependent recombination is restricted to radial glia in the adult zebrafish telencephalon. However, we also occasionally find S100B-/GFP+ cells in the periventricular zone (one or two cells per section, data not shown). These cells are probably radial glia derived neurons that were generated in the 10 days prior to analysis. Scale bars: 100 μm in overviews, 10 μm in insets. v, ventricle. |

Stab lesion activates proneural and neurogenic gene transcription specifically in the VZ. (A) The expression of the proneural gene ascl1 is strongly upregulated in the dorsal and lateral part of the VZ of the lesioned dorsal telencephalon 3 dpl, compared with the control hemisphere (arrows). In situ hybridisation in 14 µm cryosections shows that ascl1 is only weakly expressed in the lateral part of the dorsal VZ in the control hemisphere (insets). Expression along the medial ventricle is not obviously altered in the lesioned side. (B) By 3 dpl, the expression of the neurogenic gene deltaD is strongly upregulated in the dorsal and dorsomedial VZ (dashed line) of lesioned hemispheres, as detected by in situ hybridisation. Scale bars: 200 μm in A, 100 μm in insets and in B. Dashed circles represent the lesion canal. |
NeuroD expression marks the dorsal telencephalon of adult zebrafish. The expression of the basic helix loop helix transcription NeuroD (red) marks the territory of the dorsal telencephalon (dashed outline). Neuronal tracts that are positive for NeuroD are also found in the ventral telencephalon, but nuclear localisation in neurons is restricted to the dorsal part of the adult telencephalon. The area framed in the inset indicates the location of the single confocal section displayed in Fig. 7B. Scale bar: 100 μm. |