
- Title
-
Generation of Rab-based transgenic lines for in vivo studies of endosome biology in zebrafish
- Authors
- Clark, B.S., Winter, M., Cohen, A.R., and Link, B.A.
- Source
- Full text @ Dev. Dyn.
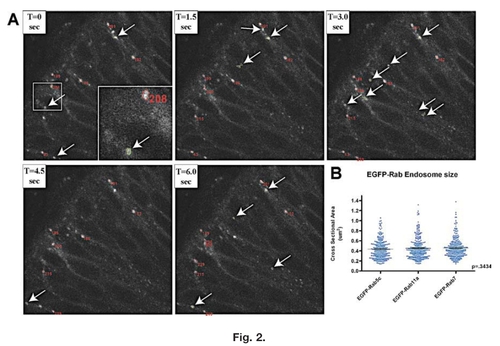
Tracking and cross-sectional area. Determination of EGFP-Rab-positive endosomes. A: Example of the tracking software over five time-series of an EGFP-Rab5c embryo. Tracked endosomes are automatically circled in red and are given an identification number to correlate numerical data in generated spreadsheets with visual images. Arrows point to endosomes recognized by the program (outlined in green) that were not followed for a minimum of five consecutive frames, and, therefore, no data were obtained from these endosomes and they were not given identification numbers. Insert in panel T=0 is a higher magnification of the boxed region showing numbering and outlining of tracked endosomes. T represents progression of time in seconds between frames. B: Distribution of cross-sectional area measurements determined for each of the EGFP-Rab lines. Most of the tracked endosomes have cross-sectional areas between 0.2 and 0.6 μm2, with very few endosomes larger than 1 μm2. P value is calculated from a one-way ANOVA. EXPRESSION / LABELING:
|
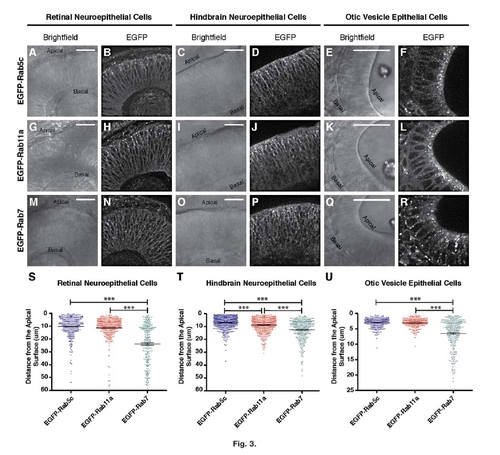
Expression and polarization of EGFP-Rab fusion proteins in neuroepithelial cells. Representative single-plane, confocal images of 28hpf embryos expressing (A–F) EGFP-Rab5c, (G–L) EGFP-Rab11a, or (M–R) EGFP-Rab7. Distinct fluorescent endosomes can be visualized as bright structures above a general membrane background in B, D, F, H, J, L, N, P, and R. Bright-field images (A, C, E, G, I, K, M, O, and Q) illustrate the structure of the developing epithelium with apical and basal surfaces indicated. Scale bars = 25 µm;. Asterisk in E, K, and Q indicates the presence of the anterior otolith. S–U: Quantification of endosome distance from the apical surface in (S) retinal neuroepithelial cells, and (T) hindbrain epithelial cells, (U) otic vesicle epithelial cells. In each cell type, EGFP-Rab5c, and EGFP-Rab11a, polarization is more towards the apical surface than EGFP-Rab7-positive endosomes. N>200 endosomes from images of 10 embryos across multiple clutches for each genotype and cell type. Mean distance from the apical surface is indicated with error bars indicating SEM. One-way ANOVA results indicate P < 0. 0001 for each cell type, followed by the Tukey′s post-test with ***P < 0.001. EXPRESSION / LABELING:
|
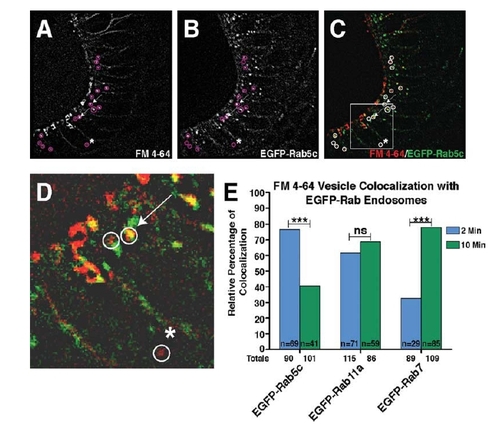
FM 4-64 injections into the developing otic vesicle indicate progression of endosome sub-types. A–C: 50-µm images thresholded for high fluorescence providing an example of FM 4-64 dye injection into the otic vesicle of a 28hpf EGFP-Rab5c embryo, 2 min post-injection. Single-channel images show intracellular puncta positive for the FM 4-64 dye (A), EGFP-Rab5c (B), and merged in C. D: Boxed image in C is magnified. Circles in A–D indicate non-membrane-associated, intracellular FM 4-64-positive vesicles. Arrows indicate examples of vesicles positive for both EGFP-Rab5c and the FM 4-64 dye, while the asterisk (*) indicates an FM 4-64-positive vesicle that is EGFP-Rab5c negative. E: Quantification of the percentage of FM 4-64-positive vesicles that co-localize with EGFP-Rab-positive vesicles at 2 and 10 min post-FM 4-64 dye injection. Numerical values below the x-axis indicate total number of FM 4-64 puncta analyzed from a minimum of 10 embryos. n-values indicate total number of FM 4-64 vesicles positive for EGFP-Rab at each time-point. Statistical Analysis: Fisher′s Exact Test. ***P < 0.001; ns, not significant. |
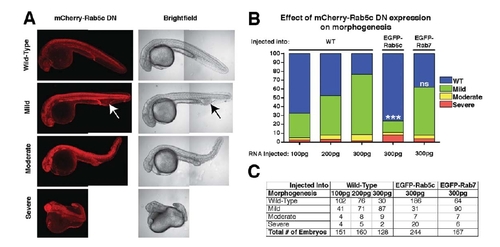
Dosage-dependent defects of mCherry-Rab5cDN expression are rescued by expression of the EGFP-Rab5c transgene. A: Representative montaged confocal images of 24hpf embryos showing phenotypic designations of Wild-type (WT), Mild, Moderate, or Severe after injection with mCherry-Rab5cDN RNA. Arrow indicates region of edema and blood pooling posterior to the yolk extension, characteristic of embryos with the “Mild” phenotype label. B: Quantification of relative percentage of embryos displaying phenotypes shown in A after injection of mCherry-Rab5cDN mRNA. C: Table indicating the total number of embryos examined for each category represented in B. Statistical Analysis: Chi-Squared compared to 300 pg RNA injected into WT embryo category, ***P < 0. 0001. Three or more clutches were used for each category. |
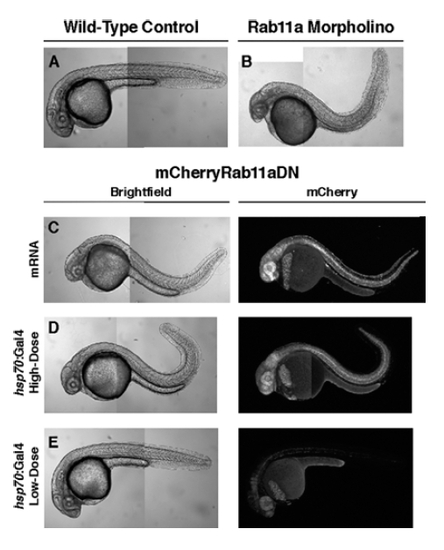
mCherry-Rab11aDN expression mimics morpholino-induced Rab11a loss-of-function. Confocal montaged images of 24–28hpf embryos examining the effect of Rab11a loss of function. A: Control embryo. B: Rab11a morphant (1.6 ng injected). C: Embryo injected with mCherry-Rab11aDN mRNA. D: Transgenic hsp70:Gal4;UAS:mCherry-Rab11aDN embryos after high-dose (30 min) heat-shock at 70% epiboly. E: Transgenic hsp70:Gal4;UAS:mCherry-Rab11aDN embryos after low-dose (10 min) heat-shock at 70% epiboly. PHENOTYPE:
|
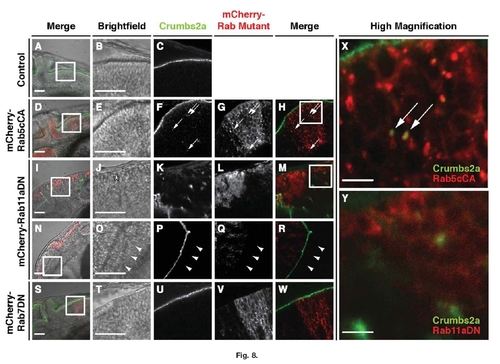
Crumbs2a localization is altered when either Rab11aDN or Rab5cCA proteins are expressed. Immunolocalization of Crumbs2a to the apical membrane in the hindbrain epithelium of (A–C) 28hpf vsx2:Gal4 control; (D–H) vsx2:Gal4;mCherry-Rab5cCA; (I–R) vsx2:Gal4/mCherry-Rab11aDN; and (S–W) vsx2:Gal4/mCherry-Rab7DN transgenic embryos. Images B,C, E–H, J–M, O–R, and U–W represent higher magnification of the boxed regions of the brightfield images in A, D, I, N, and S, respectively. Boxed regions in H and M are shown as higher magnifications in X and Y, respectively. Arrows in F–H and X indicate Crumbs2a immunostaining localized to large intracellular mCherry-Rab5cCA puncta. Hindbrain morphogenesis (asterisk in J) and Crumbs2a localization is disrupted in mCherry-Rab11aDN-expressing embryo (I–M,Y). Crumbs2a immunostaining is preserved, however, in the forebrain neuroepithelia (N–R), and in regions devoid of Rab11aDN expression as indicated by the arrowheads. S–W: Expression of mCherry-Rab7DN does not appear to affect Crumbs2a localization and expression. Scale bars in A, B, D, E, I, J, N, O, S, and T = 50 μm; scale bars in X and Y = 10 μm. |
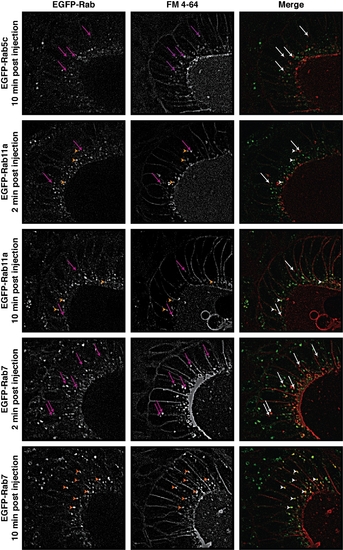
FM 4-64 lipophilic dye uptake assay examples. Additional examples of otic vesicle epithelial cells showing co-localization (arrowheads) of EGFP-Rab vesicles with internalized FM 4-64 dye at listed time-points. Arrows indicate regions where no co-localization was detected. Scale bars = 5 μm. |
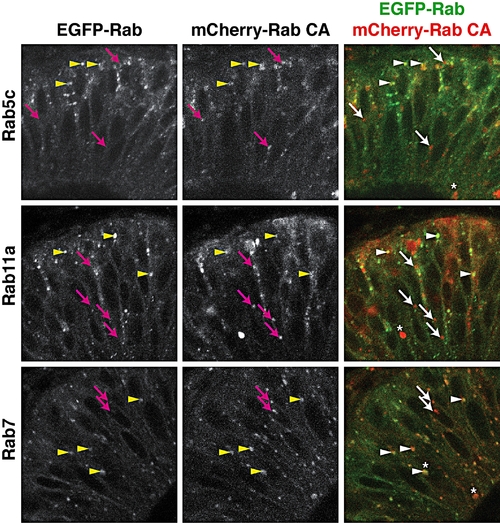
Partial co-localization of EGFP-Rab and mCherry-Rab consitutive active proteins. Fifty-micrometer, single-plane, confocal sections of retinal neuroepithelial cells from EGFP-Rab transgenics injected with corresponding mCherry-rab CA mRNA (for example, EGFP-Rab5c embryos injected with mCherry-rab5c CA mRNA). Arrowheads indicate mCherry-RabCA puncta that co-localize with transgenic EGFP-Rab vesicles, whereas arrows indicate non-colocalizing mCherry-RabCA puncta. Asterisks illustrate the presence of large vesicular structures that undergo dynamic movements in time-lapse images similar to EGFP-Rab vesicles. |
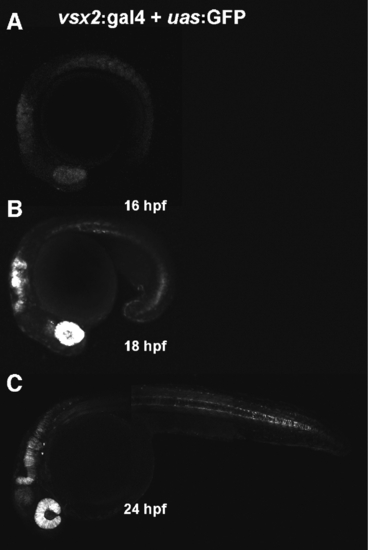
Developmental time-course of vsx2:Gal4 transgenic expression. Time-course of double transgenics resulting from matings of the vsx2:Gal4 transgenics to UAS:GFP transgenics. A: GFP expression driven by Gal4 trans-activation begins at 16hpf in the optic cup and developing nervous system. B: By 18hpf, strong expression is seen in the developing neural retina and hindbrain, in addition to expression in the trunk. C: Expression is maintained in the neural retina, hindbrain, and trunk at 24hpf, and down-regulates as cells become post-mitotic (data not shown). EXPRESSION / LABELING:
|