- Title
-
Tfap2a and Foxd3 regulate early steps in the development of the neural crest progenitor population
- Authors
- Wang, W.D., Melville, D.B., Montero-Balaguer, M., Hatzopoulos, A.K., and Knapik, E.W.
- Source
- Full text @ Dev. Biol.
|
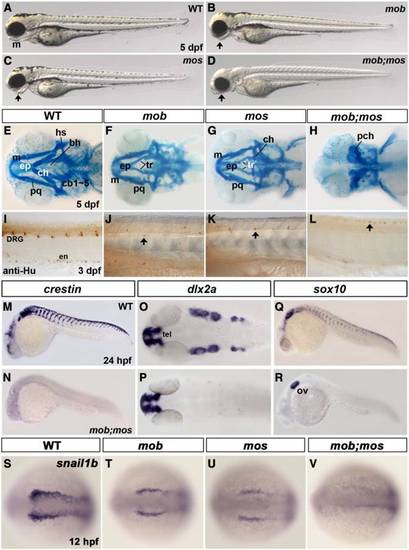
mob;mos double mutant embryos exhibit complete absence of neural crest and its derivatives. (A–D) Lateral view of wild-type (WT) (A), mob (B), mos (C), and mob;mos (D) live embryos at 5 dpf. In mob and mos embryos the Meckel′s cartilage (m) is pointing ventrally (arrows in B,C). In mob;mos embryos, the ventral part of the head (arrow in D) is ventrally concave and skin pigmentation is absent. (E–H) Ventral view of Alcian blue-stained heads showing the craniofacial skeleton of WT (E), mob (F), mos (G), and mob;mos (H) embryos at 5 dpf. Pharyngeal cartilage elements corresponding to the second and posterior arches are reduced in mob and mos embryos; in mob;mos embryos, all pharyngeal cartilage is absent, and the neurocranium is deformed. bh, basihyal; cb 1–5, ceratobranchials 1–5; ch, ceratohyal; ep, ethmoid plate; hs, hyosymplectic; m, Meckel′s cartilage; pch, parachordal; pq, palatoquadrate; tr, trabecula. (I–L) Lateral view of trunk regions of WT (I), mob (J), mos (K), and mob;mos (L) embryos stained with anti-Hu antibody to label dorsal root ganglia (DRG) and enteric neurons (en) at 3 dpf. DRG and enteric neurons are reduced and scattered in mob and mos embryos (arrows in J,K) and absent in mob;mos embryos. In contrast, Rohon–Beard neurons are present in double mutants (arrow in L). (M–R) Migratory neural crest cells are absent in mob;mos embryos. In situ hybridization analysis for genes expressed in migratory neural crest cells in WT (M, O, Q) and mob;mos (N, P, R) embryos at 24 hpf. Embryos in (O, P) are flattened and shown in dorsal view, the rest in lateral views. crestin (M, N) expression in the migratory neural crest is completely absent in mob;mos embryos. dlx2a (O, P) is expressed in the telencephalon (tel), diencephalon, and migratory neural crest streams in the head of wild-type embryos, but absent in mob;mos embryos. sox10 (Q, R) is expressed in non-ectomesenchymal neural crest cells and otic vesicles (ov) of wild-type embryos, while in mob;mos embryos, sox10 is only expressed in otic vesicles. (S–V) Dorsal view of WT (S), mob (T), mos (U) and mob;mos (V) embryos showing expression of snail1b at 12 hpf in premigratory neural crest, which is completely absent in mob;mos embryos. EXPRESSION / LABELING:
PHENOTYPE:
|
|
Apoptosis is not the primary cause of the mob;mos double mutant phenotype. (A, B) Lateral view of acridine orange (AO) staining of wild-type (WT) (A) and mob;mos (B) embryos at 10 hpf. (C, D) Dorsal view of TUNEL assay in WT (C) and mob;mos (D) embryos revealing more apoptotic cells in the neural plate region of mob;mos embryos at 10 hpf. (E) Quantification of TUNEL positive cells in the neural plate region of WT, mob, foxd3-MO-injected, and foxd3-knockdown mob embryos. Each spot represents one embryo. n signifies the number of embryos counted. Error bars represent standard deviation. Data analyzed by Student′s t-test, *P < 0.05, **P < 0.01, and ***P < 0.001. (F–J) Suppression of apoptosis by knock-down of p53 does not rescue the phenotype in mob;mos embryos. Lateral view of anti-Hu immunostaining at 3 dpf in WT (F) and mob;mos (G) embryos injected with p53 MO. Ventral view of Alcian blue staining of the head at 5 dpf of WT (H) and mob;mos (I) embryos injected with p53 MO. The proportion of embryos in a double-heterozygote mob;mos cross showing absence of pharyngeal arch skeleton does not change upon injection of p53 MO (J). n signifies the number of embryos counted. |
|
tfap2a and foxd3 are expressed in complementary territories during gastrulation. (A–C) Lateral views of embryos showing expression of tfap2a in the non-neural ectoderm at shield and 75% and 90% epiboly. The dorsal (d), ventral (v), anterior (a) and posterior (p) sides are indicated. (D–I) Lateral (D–F, dorsal to the right) and dorsal (G–I, anterior side up) views of foxd3 expression in the organizer and at the dorsal margin at shield and 75% epiboly. By 90% epiboly, expression is restricted to axial mesoderm and lateral margin involuting cells. (J, K) Double in situ hybridization of tfap2a (blue) and foxd3 (red) at 75% epiboly showing the mutually exclusive, complementary expression pattern of the two factors in a lateral (J) and vegetal (K) view. (L) Digitization of tfap2a and foxd3 expression territories during gastrulation relative to the induction area of neural crest based on the corresponding in situ hybridization expression data at 75% epiboly. EXPRESSION / LABELING:
|
|
Bmp signaling is expanded in mob;mos embryos. (A–H) bmp2b (A–D) and bmp4 (E–H) expression domains (blue) are expanded in mob and mos embryos and further enlarged in mob;mos embryos at 8 hpf. Embryos are oriented according to the position of the prechordal plate marker hgg1 (red). (I–P) The expression domain of chordin is reduced in mob and mos embryos and further diminished in mob;mos embryos. Lateral views I–L; Vegetal views M–P. Arrowheads point to the limits of the signal-positive chordin domain in vegetal view, dorsal side to the right (M–P). (Q–X) The phospho-Smad1/5/8-positive (P-Smad) domain representing active Bmp signaling is increased in mob and mos embryos and further expanded in mob;mos embryos. Embryos in Q–T are shown in lateral view dorsal side to the right, and in U–X in vegetal view, dorsal side to the right. Arrowheads (U–X) point to the limits of the P-Smad domain. EXPRESSION / LABELING:
|
|
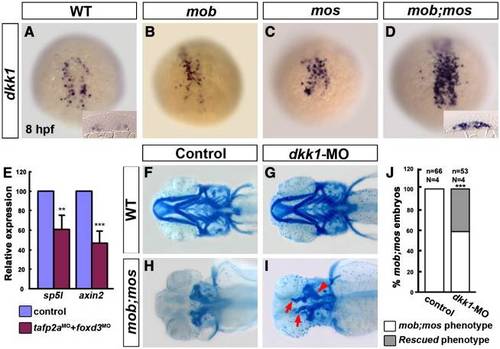
Expression of dkk1, a Wnt signaling inhibitor, is increased in mob;mos embryos, whereas expression of canonical Wnt targets is suppressed. (A–D) Dorsal view of embryos stained with dkk1 riboprobes in wild-type (WT) (A), mob (B), mos (C), and mob;mos (D) at 75% epiboly (8 hpf). dkk1-positive cells are slightly more in mob or mos, but are highly increased in mob;mos embryos. Insets in A and D show transverse sections through the dkk1-expressing region in the mesendoderm. (E) Quantitative PCR analysis of canonical Wnt signaling targets axin2 and sp5l mRNA levels in wild-type embryos and tfap2a-and foxd3-MO knockdown morphants at 8 hpf. Error bars represent standard deviation. Data analyzed by Student′s t-test, **, P < 0.01 and ***, P < 0.001. (F–I) Morpholino-mediated knockdown of dkk1 partially restores pharyngeal arch formation in mob;mos embryos. Ventral view of Alcian blue-stained heads at 5 dpf showing the craniofacial skeleton of wild-type (F), dkk1 morphants (G), mob;mos (H), and dkk1-MO knockdown mob;mos (I) embryos. Head cartilage in mob;mos embryos injected with dkk1-MO is partially restored (red arrows). (J) Percentage of mob;mos embryos with no pharyngeal skeleton and rescued pharyngeal arches with or without (Control) dkk1-MO injection. n indicates the number of embryos examined, N the number of experiments performed. Data analyzed by Chi-squared test; ***, p < 0.001. EXPRESSION / LABELING:
PHENOTYPE:
|
|
Simultaneous overexpression of tfap2a and foxd3 induces ectopic neural crest. (A–D) Dorsal view (anterior to the left) showing expression of sox10 at 12 hpf in wild-type (WT) embryos (A), embryos injected with 150 pg of tfap2a mRNA (B), 15 pg of foxd3 mRNA (C) or 150 pg of tfap2a and 15 pg of foxd3 mRNAs (D). Arrowhead indicates ectopic sox10 expression in tfap2a + foxd3 mRNA injected embryos. (E–H) Gene expression in wild-type (WT) and tfap2a + foxd3 mRNA injected embryos. Lateral view (anterior to the left) of fgf8 (E) expression at 8 hpf and pea3 (F) expression at 10 hpf. Dorsal view (anterior to the top) of egr2b (r3, r5) and six3b (fb) at 12 hpf (G). Animal view (dorsal to the bottom) of hgg1, dlx3b, and shh (H) expression at 10 hpf. Abbreviations: fb, forebrain; ne, neural ectoderm; nne, non-neural ectoderm; pp, prechordal plate r3, rhombomere 3; r5, rhombomere 5. |
|
foxd3-MO knockdown in mutant mob embryos replicates the phenotype of mob;mos embryos. (A, B) Lateral view of live mob;mos (A) and foxd3-MO knockdown mob (mob + foxd3-MO) (B) embryos at 5 dpf. The two phenotypes show comparable lack of all skin pigmentation and concave heads in the ventral part. (C, D) Ventral view of Alcian blue-stained craniofacial skeleton in mob;mos (C) and foxd3-MO knockdown mob (D) embryos at 5 dpf. In both cases, pharyngeal cartilage is absent and the neurocranium is deformed. |
|
Premigratory neural crest is absent in mob;mos embryos. Dorsal view (anterior to the left) of wild-type (WT) (A, E), mob (B, F), mos (C, G), and mob;mos (D, H) embryos showing expression of sox10 (A–D) and sox9b (E–H) in the premigratory neural crest at 11 hpf and 12 hpf, respectively. sox10 expression is completely absent in mob;mos embryos, while sox9b is limited to placodal territories. |
|
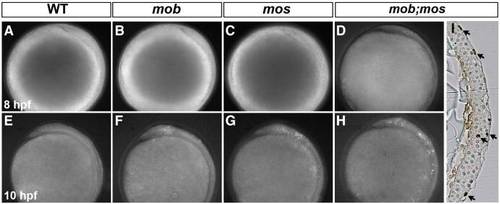
Apoptotic cells in the neural plate are increased in mob, mos, and mob;mos embryos. Lateral view (dorsal to the right) of wild-type (WT) (A, E), mob (B, F), mos (C, G), and mob;mos (D, H) live embryos stained with acridine orange dye at 8 (A–D) and 10 (E–H) hpf. At 8 hpf, only mob;mos embryos show a few dying cells in the neural plate, whereas at 10 hpf, dying cells are present in the neural plate of mob and mos embryos and dramatically increased in mob;mos embryos. (I) Coronal section of TUNEL-stained mob;mos embryos at 10 hpf. Arrows indicate TUNEL-positive cells at, or close to the neural plate surface. |
|
Inhibition of apoptosis in mob;mos embryos by p53-MO injection. TUNEL assay in wild-type (WT) embryos (A), mob embryos injected with foxd3 morpholino (B) and mob embryos injected with both foxd3 and p53 morpholinos (C) at 10 hpf shown in dorsal view with anterior side up. p53 knockdown largely reduces apoptosis in embryos without Tfap2a and Foxd3 function. |
|
fgf8 expression is unaffected in mob;mos embryos. Lateral views (dorsal side to the right) of wild-type (WT), mos, mob and mob;mos embryos showing expression of fgf8 at 8 hpf. |
|
foxd3 expression in mos embryos is reduced in the lateral margins. Lateral view of wild-type (WT) (A,D,F) and mos embryos (B,E,G) showing foxd3 expression at different stages during gastrulation. (C) Overlay of foxd3 expression in WT (blue) and mos (red) embryos at shield stage indicates missing foxd3 expression at the lateral margin (arrowhead) in mos embryos that is necessary for neural crest induction. |
|
Expression of Wnt target genes is reduced in mob;mos embryos. Vegetal view of wild-type (WT) (A, C) and tfap2a-MO + foxd3-MO injected (B, D) embryos after in situ hybridization for the canonical Wnt signaling target genes axin2 (A, B) and sp5l (C, D) at 8 hpf. |
|
Partial rescue of mob;mos pigment phenotype by dkk1-MO. Ventral view of Alcian blue-stained heads showing the craniofacial skeleton (A) and lateral view of live embryos showing the pigmentation (B) of uninjected (UIC) and dkk1-MO mob;mos embryos at 4 dpf. Two examples of partially (middle panels) and more complete (lower panels) rescued embryos are shown. |
Reprinted from Developmental Biology, 360(1), Wang, W.D., Melville, D.B., Montero-Balaguer, M., Hatzopoulos, A.K., and Knapik, E.W., Tfap2a and Foxd3 regulate early steps in the development of the neural crest progenitor population, 173-85, Copyright (2011) with permission from Elsevier. Full text @ Dev. Biol.


