
- Title
-
Lef1-dependent Wnt/β-catenin signalling drives the proliferative engine that maintains tissue homeostasis during lateral line development
- Authors
- Valdivia, L.E., Young, R.M., Hawkins, T.A., Stickney, H.L., Cavodeassi, F., Schwarz, Q., Pullin, L.M., Villegas, R., Moro, E., Argenton, F., Allende, M.L., and Wilson, S.W.
- Source
- Full text @ Development
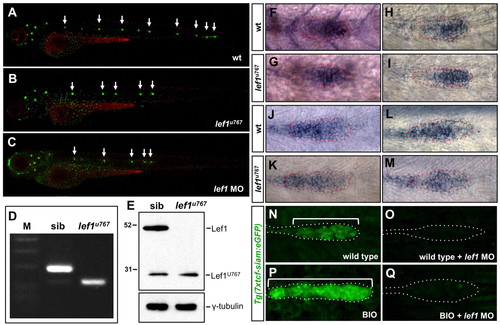
Characterisation of the zebrafish lef1u767 mutant. (A-C) Lateral views of wild-type (A), lef1u767 (B) and lef1 morphant (C) 3 dpf zebrafish embryos stained with DiAsp/DiOC6. Arrows indicate positions of PLL neuromasts. (D) RT-PCR from sibling and lef1u767 cDNA using primers targeting exons 1 and 3. Mutant lane shows a 121 nucleotide band lacking 67 nucleotides of exon 2. DNA marker lane shows 400, 300, 200 and 100 bp bands. (E) Western blot showing absence of Lef1 band in lef1u767 mutant. (F-M) Expression of lef1 (F,G), tcf7 (H,I), tcf7l1a (J,K) and tcf7l2 (L,M) in wild-type (F,H,J,L) and lef1u767 mutant (G,I,K,M) 33 hpf embryos. Primordia are outlined. (N-Q) GFP expression in control Tg(7Xtcf-siam:GFP)ia4 Wnt reporter (N), lef1 morphant (O), BIO incubated (P) and BIO-incubated/lef1-morphant (Q) 36 hpf embryos. PLLP is outlined in each case. Brackets indicate the length of the primordium. EXPRESSION / LABELING:
PHENOTYPE:
|
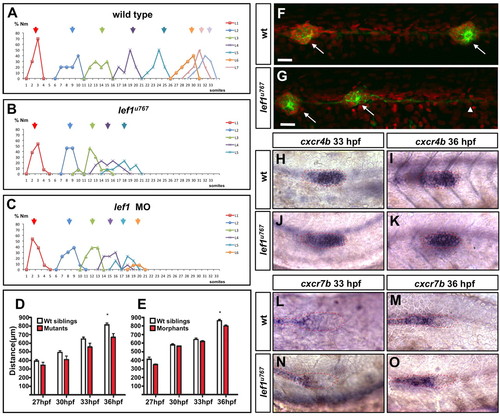
Neuromast position, primordium kinetics and chemokine receptor expression are unaffected by loss of Lef1 function. (A-C) Histograms depicting the number/position of neuromasts in siblings (A) lef1u767 mutants (B) and lef1 morphants (C) at 3 dpf. Arrows indicate the average position and colours denote the different populations of sequentially deposited neuromasts. (D,E) Plot of the distance (in μm) in lef1u767 mutants (D) and lef1 morphants (E) between the caudal limit of the otic vesicle and the leading edge of the PLLP at 27, 30, 33 and 36 hpf (n=7 mutants/morphants and n=15 wild types in both cases). The only significant difference is observed at 36 hpf (*P<0.01, Wilcoxon rank-sum test). Data are mean+s.d. (F,G) GFP [Tg(-8.0cldnb:lynEGFP)zf106]-positive cells extend beyond the terminal neuromast in 55 hpf lef1u767 embryos (arrowhead). Arrows indicate neuromasts L4 and L5. Nuclei are counterstained with propidium iodide. Scale bar: 20 μm. (H-O) Expression of cxcr4b (H-K) and cxcr7b (L-O) in wild type (H,I,L,M) and lef1u767 mutants (J,K,N,O) at 33 and 36 hpf. PHENOTYPE:
|
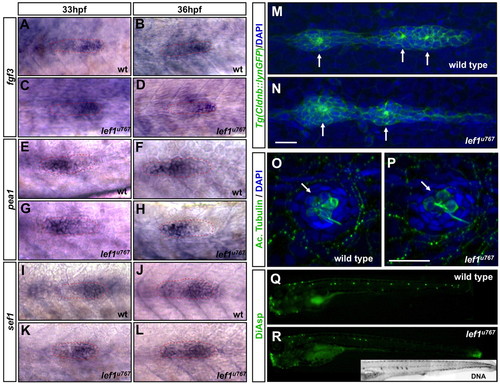
Primordium organisation, neuromast morphology and differentiation are unaffected by loss of Lef1 function. (A-L) Expression of fgf3 (A-D), pea1 (E-H) and sef1 (I-L) in wild type (A,B,E,F,I,J) and lef1u767 mutants (C,D,G,H,K,L). Primordia are outlined. (M,N) Tg(-8.0cldnb:lynEGFP)zf106-labelled wild-type (M) and lef1u767 (N) primordia at 38 hpf. Membrane-anchored GFP reveals the polarisation of cells and their organisation into rosettes (arrows). (O,P) The last-deposited neuromast in a lef1u767 mutant (P) and wild type (O) labelled with anti-acetylated tubulin antibody (green). Nuclei are DAPI stained. Scale bar: 20 μm. (Q,R) Diasp staining in wild type (Q) and lef1u767mutant (R) at 3 dpf. DAPI-labelling of nuclei (inset in R) shows no more neuromasts in the lef1u767 other than those labelled with Diasp). |
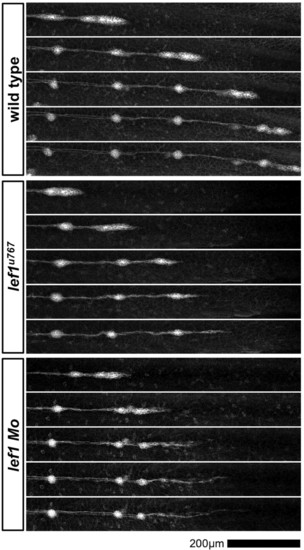
Time-lapse analysis of primordium migration in Tg(-8.0cldnb:lynEGFP) embryos. Frames were taken from time-lapse movies of wild type (top panel), lef1u767 (middle panel) and lef1 morphant (bottom panel). Frames are spaced at approximately 2-hour intervals. |

Mutant PLL primordia collapse is due to decreased proliferation and depletion of leading zone cells. (A-H) Cell proliferation analysis in wild-type (A-D) and lef1u767 mutant (E-H) Tg(-8.0cldnb:lynEGFP)zf106 embryos. After BrdU pulse and chase, embryos were fixed after deposition of neuromast L1 (A,E), L2 (B,F), L3 (C,G) and L4 (D,H). Brackets show the primordium. Scale bars: 20 μm. (I) BrdU-positive cells/total cell ratio in wild type (white bars) and lef1u767 mutants (red bars) after one to four deposited neuromasts. Total cells where counted after DAPI staining nuclei. Significance was tested with Wilcoxon rank-sum test (***P<0.001). Data are mean+s.d. (J,K) 48 hpf aphidicolin/hydroxyurea-treated Tg(cldnb:lynGFP)zf106 embryos show three or four widely spaced neuromasts and a caudally extended row of cells (J). Red arrows indicate neuromasts. (K) Amplification of red rectangle in J. (L-O) Kaede photoconverted leading edge cells at 24 hpf in wild type (L) and lef1u767 (N) assessed at 35 hpf (M,O). Brackets indicate preformed neuromasts. (P,Q) Ablation of the caudal third of PLLP at 24 hpf leads to a lef1u767-like phenotype with 20%, 33.3% and 46.6% of the embryos displaying 3, 5 and 7 neuromasts respectively at 72 hpf (15 ablated specimens). Red arrows indicate neuromasts. (Q) Inset from P with red arrow showing the remaining migrating cells. |
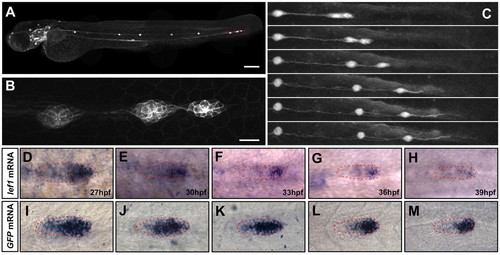
Terminal neuromast formation in the wild-type PLL primordium. (A) Lateral view of a 72 hpf Tg(-8.0cldnb:lynEGFP)zf106 larvae. Scale bar: 200 μm. (B) The last three neuromasts from A. Scale bar: 20 μm. (C) Frames from Movie 4 in the supplementary material starting as the seventh neuromast is being deposited. Times between selected frames are 2, 5, 8, 5.3 and 4 hours. There is almost no difference between the last two frames, even though 4 hours have passed. (D-H) Expression of lef1 at 27, 30, 33, 36 and 39 hpf in wild-type embryos. (I-M) mRNA expression of Tg(7Xtcf-siam:GFP)ia4 at 27, 30, 33, 36 and 39 hpf in wild-type embryos. Primordia are outlined in red. EXPRESSION / LABELING:
|
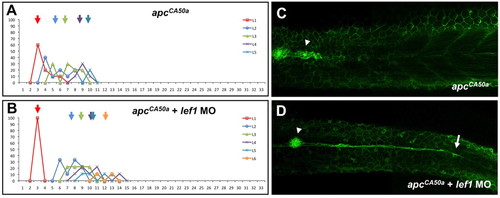
Lef1 is epistatic to APC in controlling leading zone cell behaviour. (A,B) Histogram depicting the number/position of neuromasts in apcCA50a (A) and apcCA50a mutant/lef1-morphant (B) embryos. Arrows indicate the average position and colours denote the different populations of sequentially deposited neuromasts. (C,D) apcCA50a (C) and apcCA50a mutant/lef1-morphant (D) Tg(-8.0cldnb:lynEGFP)zf106 embryos showing groups of cells migrating caudally after the primordium has stalled (arrowheads). Arrow in D indicates the extended trail of cells in morphants. |
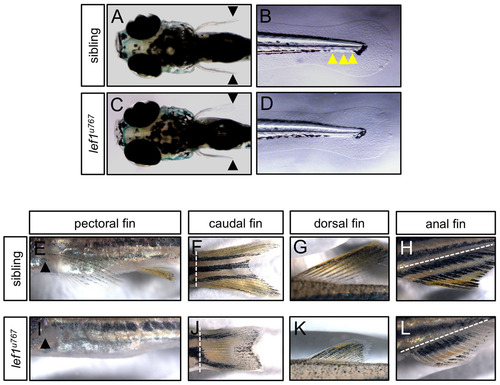
Adult but not embryo fin development is impaired in lef1φ767 mutant. (A-D) Six-day-old sibling (A,B) and lef1u767 mutant (C,D) embryos showing that there is no difference in pectoral (A,C) or caudal (B,D) fin development. Black arrows show similar length in pectoral fins in sibling and mutant embryos. Yellow arrows show the last three neuromasts in the sibling embryo. Sibling and mutant embryos where discriminated using DiAsp/DiOC6 vital dye staining for lateral line neuromasts. (E-L) Thirty-day-old wild-type (E-H) and lef1u767 mutant (I-L) embryos show significant differences in pectoral (E,I), caudal (F,J), dorsal (G,K) and anal (H,L) fin development. Black arrows show the pectoral fin growth point. Broken white lines show limit between body and fin. |
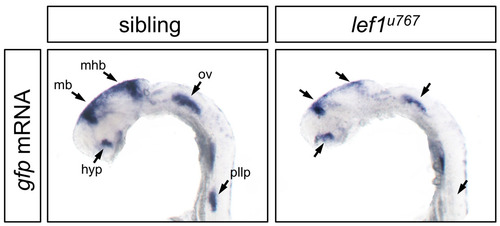
Lef1 is required for GFP expression in Tg(7Xtcf-siam:GFP)ia4 in specific domains. (A) gfp mRNA levels in 24 hpf sibling transgenic embryo, where arrows depict midbrain (mb), midbrain-hindbrain boundary (mhb), otic vesicle (ov), hypothalamus (hyp) and posterior lateral line priimordium (pllp). (B) lef1u767 embryos show a strong reduction of GFP expression in the PLLP and hindbrain, but only a mild or no reduction in other depicted structures. |
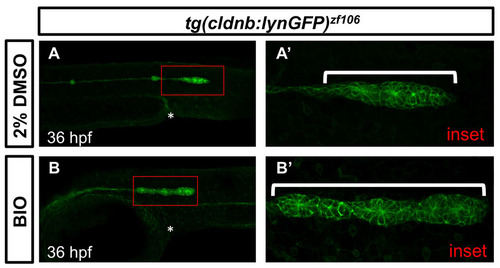
Incubation of embryos in BIO resembles the phenotype observed in PLL primordium in APC mutants. Notice that the BIO treated primordium (B) is hypertrophic and is stalled around the beginning of the yolk extension (white asterisk), whereas the 2% DMSO control primordium has already deposited the third neuromast and is migrating beyond the end of the yolk extension (white asterisk). Insets in A and B are in A′ and B′. |
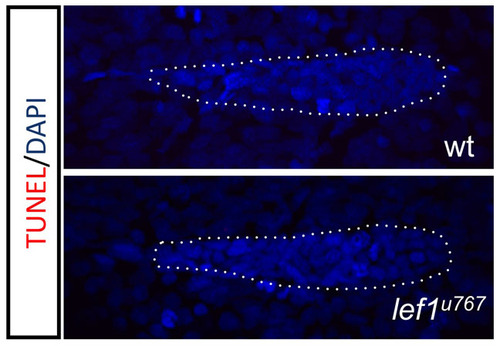
There is no excess apoptosis in lef1 mutants. Whole-mount TUNEL assay at 33 hpf. (A) Wild-type and (B) lef1767 mutant embryos. |