
- Title
-
Embryonic expression of zebrafish MiT family genes tfe3b, tfeb, and tfec
- Authors
- Lister, J.A., Lane, B.M., Nguyen, A., and Lunney, K.
- Source
- Full text @ Dev. Dyn.
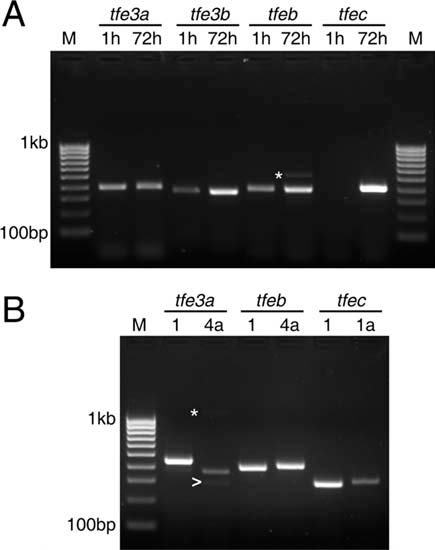
MiT isoforms expressed during embryogenesis. A: Reverse transcriptase-polymerase chain reaction (RT-PCR) demonstrating expression of MiT genes at 1 and 72 hr postfertilization. M, 100 basepair ladder markers. B: RT/PCR with isoform-specific primers at 72 hours postfertilization (hpf). Asterisks indicate nonspecific products; arrow indicates tfe3a transcript lacking exon 6. EXPRESSION / LABELING:
|
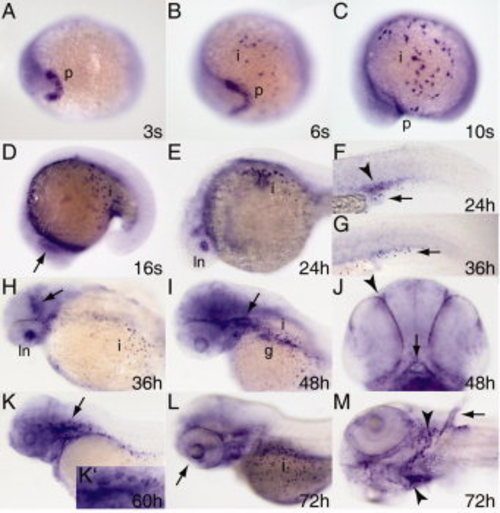
Expression pattern of tfe3b during embryogenesis. Whole mount RNA in situ hybridization was performed on embryos at the stages indicated. A–C: Expression begins in the polster (A,B) and is seen shortly thereafter in ionocytes (B,C). D,E,H: Expression is observed in the lens placode at the 16-somite stage (D, arrow), and thereafter (up to 36 hours postfertilization [hpf]) in the lens itself (E,H). F,G: Expression in the intermediate cell mass (arrowhead, F) is seen at 24 hpf but has disappeared by 36 hpf (G; arrows indicate ionocytes). H,I: tfe3b is expressed at the mid-hindbrain boundary at 36 hpf (arrow, H) and in the otic epithelium (arrow, I) as well as gut tissue and ionocytes, and more diffusely through the head at 48 hpf. J: Expression is also seen in the olfactory pits (arrowhead) and mouth (arrow) at this stage. K: At 60 hpf, tfe3b is expressed in the epithelial protrusions of the dorsal otocyst (arrow; K2, higher magnification). L: Ciliary margin expression (arrow). M: Expression in ionocytes associated with the branchial arches (arrowheads) and in pectoral fin cartilage (arrow). All views lateral except A,B,J, ventral view; H,I, dorsolateral view; M, ventrolateral view. Abbreviations: p, polster; i, ionocytes; ln, lens; g, gut. EXPRESSION / LABELING:
|
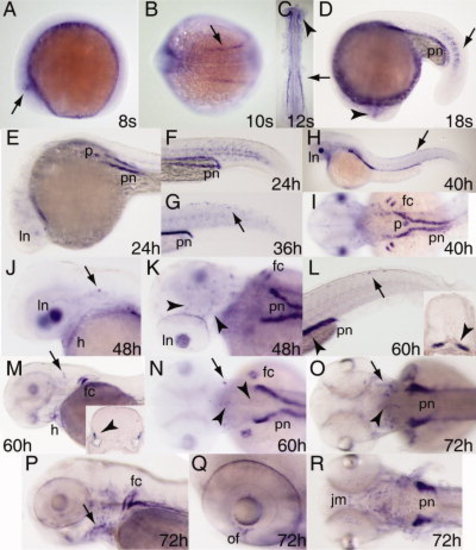
Expression pattern of tfeb during embryogenesis. Whole mount RNA in situ hybridization was performed on embryos at the stages indicated. Expression is first observed in the eye (arrowheads in A,C,D), and shortly thereafter in the paraxial and lateral plate mesoderm (arrows in B–D). Lens expression increases between 24 and 48 hpf (E,J) and diminishes thereafter. tfeb expression is observed in the pronephros along most of its length from 18 somites (D, shown in transverse section in inset L, arrowhead) up to 72 hpf when it is concentrated in the proximal convoluted tubules (O,R). Expression in the presumptive pancreas is seen at 24 hpf (E) and 40 hpf (I) but declines thereafter (K,N). tfeb is expressed in cells along the dorsal midline (arrows in H,L), scattered cells associated with the otic capsule (arrows in J,M–O; inset in M shows transverse section through otic capsule, arrowhead indicates expressing cells) cells in the brain (arrowheads in K,N,O) and associated with the pharyngeal arches (arrow, P). Expression is also seen at 72 hpf in the optic fissure (of, Q) and jaw musculature (jm, R). A,D–H,J,L,M,P,Q, lateral views; B,I,N,O, dorsal views; K, dorsolateral view; R, ventral view. pn, pronephros; ln, lens; p, pancreas; fc, fin cartilage; h, heart. EXPRESSION / LABELING:
|

Expression pattern of tfec during embryogenesis. Whole mount RNA in situ hybridization was performed on embryos at the stages indicated. A–F: Expression begins in the posterior eye region/presumptive retinal pigment epithelium and a few neural crest cells at the eight-somite stage (A) and expands during somitogenesis (B–F). H–J,O–Q: The tfec-expressing cells populate bilateral patches over the yolk beginning at 24 hpf (arrows, H–J), increasing in number and extent through 72 hours postfertilization (hpf; arrowheads, O–Q), and are also found on top of the head (arrow, K) and dorso- and ventromedially in the trunk and tail (L,M), all positions characteristic of iridophores. F,L,M: Expression in the intermediate cell mass is seen by the 20-somite stage (arrowhead, F), has weakened by 36 hpf (arrowhead, L) and is gone by 60 hpf (M). Expression in the retinal pigment epithelium (arrow) and ciliary margin (arrowhead) is observed in transverse section of the eye at 60 hpf (N, dorsal is to the top). O–Q: Beginning at 48 hpf, expression is observed in the developing swim bladder (arrows). Lateral views A,B,D–G,L,M; frontal view, C; dorsolateral views, H–J; dorsal views K,O–Q. nc, neural crest; rpe, (presumptive) retinal pigment epithelium. EXPRESSION / LABELING:
|