
- Title
-
Transgenic zebrafish expressing green fluorescent protein in dopaminergic neurons of the ventral diencephalon
- Authors
- Xi, Y., Yu, M., Godoy, R., Hatch, G., Poitras, L., and Ekker, M.
- Source
- Full text @ Dev. Dyn.
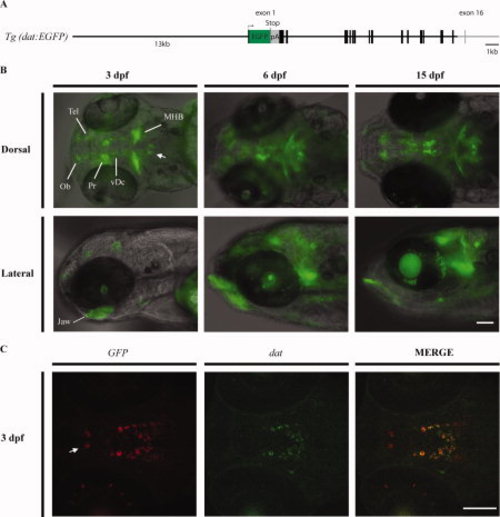
The Tg(dat:EGFP) line. A: A schematic map of the DNA fragment used in Tol2-based dat transgenesis. The total size of the inserted DNA is 27 kb, containing the whole dat genomic sequence except for the last coding exon and 32-flanking region. EGFP (in green) was inserted in frame at the beginning of exon 1. A stop codon and a polyadenylation signal sequence (pA) at the end of green fluorescent protein (GFP) are indicated. B: Reporter gene expression in Tg(dat:EGFP) larvae. A composite of different fluorescent focal planes was generated using the Image Pro software and merged with bright field image. MHB, midbrain–hindbrain boundary; Ob, olfactory bulb; Pr, pretectum; Tel, telencephalon; vDc, ventral diencephalon. The arrow indicates a group of cells in the hindbrain that express GFP and may correspond to some of the dat-expressing cells reported by Holzschuh et al. (2001). C: Double fluorescent in situ hybridization on 3 days post-fertilization (dpf) larvae with GFP (red) and dat (green) cRNA probes. The arrow indicates a group of cells in the preoptic area that express the transgene and th (not shown) but not dat. Scale bars = 100 μm. EXPRESSION / LABELING:
|

Whole-mount in situ hybridizations of tyrosine hydroxylase (th) and dopamine transporter (dat) in zebrafish embryos and larvae. Whole-mount in situ hybridization with a tyrosine hydroxylase (th) (A–F) or a dopamine transporter (dat) cRNA probe (G–L). The dopaminergic (DA) neurons in the ventral diencephalon are shown by arrowheads. A,C,E,G,I,K: Lateral views with anterior to the left. B,D,F,H,J,L: Ventral views. Scale bar = 100 μm. EXPRESSION / LABELING:
|
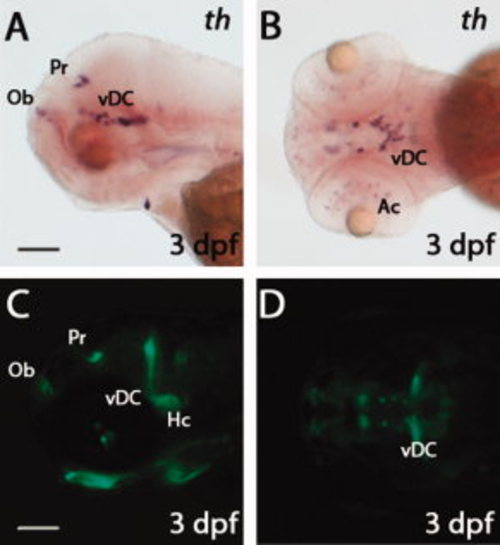
Comparison of th and green fluorescent protein (GFP) expression patterns in Tg(dat:EGFP) larvae. A,B: Whole-mount in situ hybridization showing tyrosine hydroxylase (th) expression in 3 days post-fertilization (dpf) larvae. C,D: Live images showing GFP expression in 3 dpf Tg(dat:EGFP) larvae. Panels A, C are lateral views with anterior to the left; panels B, D are ventral views. The following abbreviations are used: olfactory bulb (Ob), pretectum (Pr), ventral diencephalon (vDC), amacrine cells (Ac) and caudal hypothalamus (Hc). Scale bars = 100 μm. EXPRESSION / LABELING:
|

Double immunostaining for green fluorescent protein (GFP) and tyrosine hydroxylase (TH) in 3 days post-fertilization (dpf) Tg(dat:EGFP) larvae. Horizontal cryosections of 3 dpf Tg(dat:EGFP) larvae were stained with anti-GFP and anti-TH antibodies. GFP-positive cells, TH-positive cells and GFP/TH-positive cells are shown in green, red and yellow, respectively. The following abbreviations are used: olfactory bulb (Ob), pretectum (Pr), ventral diencephalon (vDC), amacrine cells (Ac) and caudal hypothalamus (Hc). Numbers in A23 and B23 indicate different groups (1–6) of DA neurons in the vDC. Arrows show GFP/TH-positive cells in the retina. Arrowheads show GFP/TH-positive cells in the Ob, Pr and Hc. Section (A–A23) and section (B–B23) are the same section, focusing on different cell groups when imaging. All sections are shown as anterior to the left. Scale bars = 100 μm in A–A3,B–B3,C–C3,D–D3,E–E3 25 μm in A23,B23,C23,D23,E23. EXPRESSION / LABELING:
|

Whole-mount immunostaining for green fluorescent protein (GFP) and tyrosine hydroxylase (TH) in 3 days postfertilization (dpf) Tg(dat:EGFP) larvae. The 3 dpf Tg(dat:EGFP) larvae were stained with anti-GFP and anti-TH antibodies, followed by confocal microscopy. GFP-positive cells and TH-positive cells are shown in green and red respectively. A–H: A series of confocal images focusing at different levels in the ventral diencephalon (vDC). I: Projection of confocal images A–H. Numbers in I indicate different DA neuron groups (1–6) in vDC. The animals are shown as dorsal views with anterior to the left. Scale bars = 25 μm. EXPRESSION / LABELING:
|
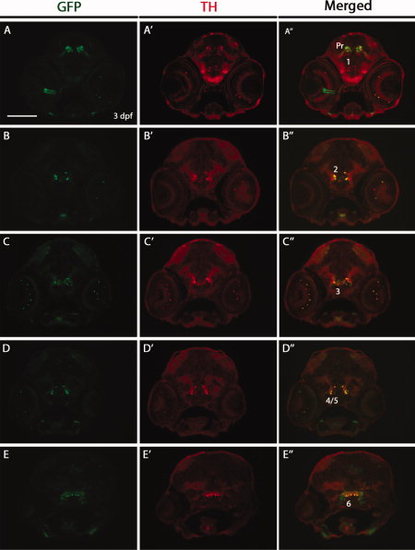
Double immunostaining for green fluorescent protein (GFP) and tyrosine hydroxylase (TH) on transverse cryosections of Tg(dat:EGFP) larvae at 3 days postfertilization (dpf). The 3 dpf Tg(dat:EGFP) embryos were transversely cryosectioned and stained with anti-GFP and anti-TH antibodies. GFP-positive cells and TH-positive cells are shown in green and red respectively. GFP expression in the optic nerve (A3) may relate to the previously reported DAT expression in astrocytes of the optic nerve (Holzschuh et al., 2001). Numbers (1–6) indicate different groups of DA neurons in the ventral diencephalon. Pr: pretectum. All sections are shown as dorsal to the top. Scale bar = 100 μm. EXPRESSION / LABELING:
|

Double immunostaining for green fluorescent protein (GFP) and tyrosine hydroxylase (TH) on horizontal cryosections of Tg(dat:EGFP) larvae at 5 days post-fertilization (dpf). The 5 dpf Tg(dat:EGFP) embryos were horizontally cryosectioned and stained with anti-GFP and anti-TH antibodies. GFP-positive cells and TH-positive cells are shown in green and red respectively. Numbers (1–6) indicate different groups of DA neurons in the ventral diencephalon. All sections are shown as anterior to the top. Scale bar = 100 μm. EXPRESSION / LABELING:
|

Effects of MPTP (1-methyl-4-phenyl-1,2,3,6-tetrahydropyridine) on green fluorescent protein (GFP) -positive neurons in the ventral diencephalon. Tg(dat:EGFP) embryos were untreated (Ctrl) or treated with MPTP at 1 mM from 24 hours post-fertilization (hpf), and examined under fluorescence microscope at 3 days post-fertilization (dpf) (A,B) and 5 dpf (C,D). The numbers of GFP-positive neurons in the ventral diencephalon (dopaminergic [DA] neuron groups 2–6) were counted and statistically analyzed (E; **P < 0.01, ***P < 0.001). F–G23: Double immunostaining for GFP and tyrosine hydroxylase (TH) on Ctrl or MPTP-treated embryos at 3 dpf. A–D: Anterior is to the bottom; F–G23: Anterior is to the left. More than 30 larvae were examined in each group. Scale bars = 25 μm. EXPRESSION / LABELING:
PHENOTYPE:
|