
- Title
-
Regulation of Zebrafish Hatching by Tetraspanin cd63
- Authors
- Trikić, M.Z., Monk, P., Roehl, H., and Partridge, L.J.
- Source
- Full text @ PLoS One
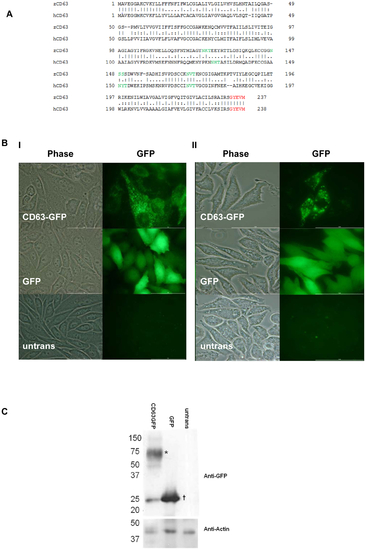
CD63 protein properties. A. Alignment between Homo sapiens (CAG46893) and Danio rerio (NP_955837). Functional motifs are highlighted; glycosylation sites are in green, lysosomal targeting motif in red. BI. CHO (Chinese Hamster ovary) cells, and BII. RBL-2H3 (rat basophilic leaukaemia) cells, transfected with Cd63-GFP, GFP, or untransfected. C. Western blot of lysates from CHO cells probed with anti GFP, with anti actin as a loading control. Ladder positions are indicated on the left in kDa. * denotes Cd63GFP, † denotes GFP. |

cd63 transcript. A & B. Location of cd63 transcript as revealed by ISH, using a probe against cd63. Developmental stages are noted below with hpf (hours post fertilisation) in brackets. In the top panel of B (I–IV), the top row gives the lateral view, bottom row ventral. In BI, arrows indicate the first expression in the pre-polster. cd63 expression continues (BII–VII). Expression in the hatching gland is indicated in BVII and BVIII, by arrows. C. RT-PCR time course using single embryos. PCR primers are indicated on the right, ef1 is a ubiquitous transcription factor used as a control. Numbers indicate ladder position in base pairs. Developmental stages are indicated at the top of the figure, each carried out in duplicate. This gel is representative of three replicates. |
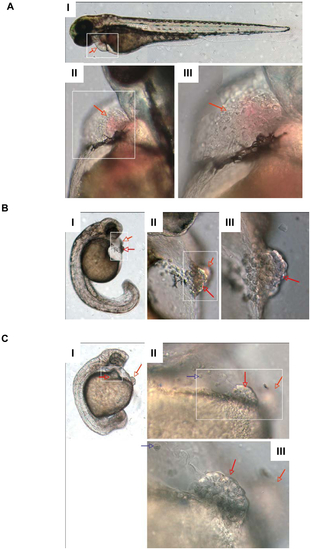
Morphology of cd63 knockdown. DIC microscopy images of the hatching glands of dechorinated 52 hour post fertilisation embryos. In each panel (A–C) I is x5 objective, white box indicates frame of II. II is x20 objective, white box indicates frame of III. III is x40 objective. II and III are montages of more than one focal plane. Red arrows point to the hatching gland, blue arrows indicate mislocalised hatching gland cells. A: Hatching gland typical of a LWT embryo. I is a montage of more than one focal plane. B: Moderately disrupted hatching gland typical after injection of 10 pg of MO4. C: Severely disrupted hatching gland typical after injection of 12 pg of MO4. PHENOTYPE:
|

Effect of knockdown. A. Effect of morpholino-induced knockdown of cd63 on hatching. Buff = buffer/mismatch injected control. Units of time are hours. Data from two experiments each using MO2 and 4 and a combined total of 671 embryos. B. MO4 mediated band shift. 1% Agarose gel of RT-PCR products from 48 hr LWT embryos using primers corresponding to full length cd63 transcript or ef1, a ubiquitous transcription factor used as a control. The 3 lanes next to the ladder are from embryos injected with 10 pg MO4, remaining lanes are from mismatch MO3 injected embryos. Similar results were seen in the 30 MO4 injected embryos tested. |

Location of cd63 transcript as revealed by ISH. A. 32 h.p.f LWT dechorinated embryos injected with 10 pg MO4 as indicated. Blue arrows indicates hatching gland; green arrows denote mis-localised hatching gland cell clumps B. One Eyed Pinhead (oep) mutants and siblings. The top row are sibling embryos homozygous or heterozygous for WT oep, where as the bottom row are homozygous for the oep deletion. EXPRESSION / LABELING:
|

Determination of mesodermal markers by ISH. Morphant embryos were injected with 10 pg MO4. A. Location of pre-chordal plate marker gsc in LWT embryos at 80% epiboly. I and II give lateral view, III and IV looking down on gsc positive staining. II and IV were injected with MO4, I and III are mis-match injected siblings. Arrows indicate gsc specific staining. B. Hatching gland marker cat L in 24 hour post fertilisation LWT embryos. I and II are morphant embryos, ventral and lateral views respectively. III and IV are mismatch injected LWT embryos, ventral and lateral views respectively. Arrows indicate hatching gland specific cat L staining. EXPRESSION / LABELING:
|

Morphant hatching gland. A. DIC microscopy images of cells of the hatching gland in a dechorinated control embryo (I and III) and morphant (II and IV) at 32 hours post fertilisation. III and IV are areas corresponding to the area of the red box in I and II respectively. Blue arrows denote intracellular granules. B and C. Analysis of hatching gland cell characteristics. Images of 3 wild type hatching glands and 3 morphant hatching glands were used for analysis with ImageJ. Distribution of data was tested to determine the relevant statistical analysis for each parameter measured. B: From each image five cells were randomly selected. Granule number was calculated and five granules randomly selected and measured. 2 tailed t-test of morphant vs. wt no. of granules per cell- no significant difference; Wilcoxon matched pairs test of morphant vs. wt granule size- p = <0.0001 *** significantly different. C: From each image five cells were randomly selected and measured at the widest diameter. 2 tailed t-test of morphant vs. wt cell size- no significant difference. PHENOTYPE:
|
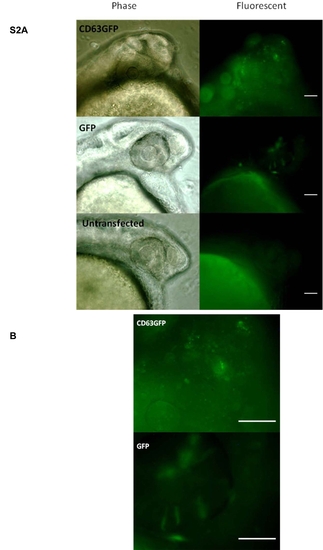
A. Localisation of Cd63GFP in 24 hr LWT embryos injected with buffer or plasmid DNA encoding Cd63GFP or EGFP, as indicated. Scale bars = 52 μm. B. Zoom of area of fluorescent Cd63GFP and GFP images in S2 A. Scale bars = 52 μm. |