- Title
-
The Enhancer of split transcription factor Her8a is a novel dimerisation partner for Her3 that controls anterior hindbrain neurogenesis in zebrafish
- Authors
- Webb, K.J., Coolen, M., Gloeckner, C.J., Stigloher, C., Bahn, B., Topp, S., Ueffing, M., and Bally-Cuif, L.
- Source
- Full text @ BMC Dev. Biol.
|
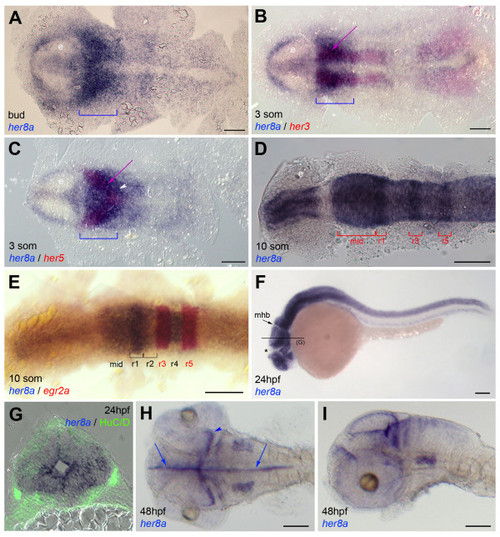
Embryonic expression of her8a. Expression is revealed by whole-mount in situ hybridization at the stages indicated (som: somites, hpf: hours post-fertilization) together with other positional marker genes (B,C,E, color-coded) or proteins (G, immunocytochemistry for the neuronal marker HuC/D in green). A-E and H are dorsal views of flat-mounted embryos, F,I are lateral views, all embryos are viewed anterior left. G is a cross section of a 24hpf embryo at midbrain levels (as indicated in F). At early neural plate stages, the domain of strongest her8a expression covers the mid- and anterior hindbrain (bracket in A-C). It overlaps the presumptive midbrain-hindbrain boundary (her5-positive, purple arrow in C) and the progenitor pools separating medial and lateral hindbrain neurons (her3-positive, purple arrow in B). It extends into rhombomere 2 (white arrowhead in C), more posterior rhombomeres being more weakly labeled. At 10 somites, expression in the midbrain is maintained. It resolves in stripes in the rhombencephalon (D,E). It avoids the midbrain-hindbrain boundary and zona limitans intrathalamica (asterisk). From 24 hpf onwards, her8a characterizes the ventricular zone and progenitor domains of the neural tube (G-I, arrows in I point to the ventricular zone and the arrowhead points to the progenitor domain of the optic tectum). Abbreviations: e: eye field, mid: presumptive midbrain, mhb: midbrain-hindbrain boundary, r: rhombomere. Scale bars: 100 μm. EXPRESSION / LABELING:
|
|
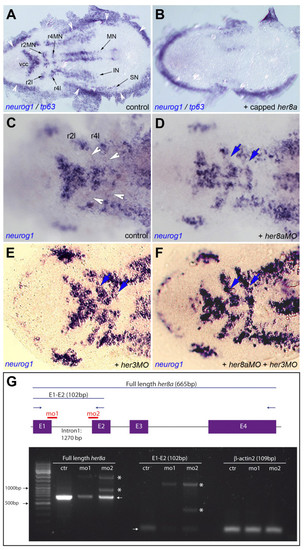
Like Her3, Her8a activity maintains the non-neurogenic areas of rhombomeres 2 and 4. A,B. neurog1 expression highlights the proneural clusters at the 3-somite stage (black arrows in A) and is eliminated upon her8a overexpression (B, embryo injected with her8a capped mRNA). Expression of tp63, which highlights the neural plate border (white arrowheads in A), is unchanged. C-F. Compared expression of neurog1 in control embryos (C) and embryos injected with her8aMO (D), her3MO (E) or both MOs (F) shows ectopic neurogenesis between the medial and lateral proneural clusters of r2 and r4 (blue arrows in D-F, compare with white arrowheads in C) when Her8a and/or Her3 activities are blocked. Few "ectopic" neurog1-positive can sometimes be found between the vcc and mnr2; this is however highly variable between individuals and observed in both control and morphant embryos. A-F are dorsal views of flat-mounted embryos, anterior left. Abbreviations: black arrows indicate proneural clusters: IN: presumptive interneurons, MN: presumptive motoneurons, r2: rhombomere 2, r4: rhombomere 4, r2l: lateral neurons of rhombomere 2, r4l: lateral neurons of rhombomere 4, SN: presumptive sensory neurons, vcc: ventro-caudal cluster. G. RT-PCR analysis of her8a expression (left and middle panels) in embryos injected with her8aMO1 ("mo1") and her8aMO2 ("mo2") versus control embryos ("ctr"). Low levels of full length, normally spliced her8a transcripts are detectable in morphants (left and middle panels, arrows) while abnormally spliced transcripts including all or part of intron 1 become produced (stars). Expression of βactin2, used as RT-PCR control, is indentical in all samples (right panel). The scheme at the top indicates the genomic structure of her8a, the position of exons (E, purple) and introns (black bars), the binding sites of her8aMO1 and MO2 (red), the position of RT-PCR primers (blue arrows) and the length of amplified wild-type products (excluding introns) (blue bars). EXPRESSION / LABELING:
PHENOTYPE:
|
|
The activities of Her3, Her5, Her9 and Her11 together account for the progenitor pool pattern of the midbrain-hindbrain area and do not influence her8a expression. A-D. A comparison of the expression patterns of her3, her5, her9, her11 and neurog1 at 3 somites in the midbrain-hindbrain (MH) area using double in situ hybridization (color-coded), on dorsal views of flat-mounted embryos. Arrows point to the her5/her11 domains co-expressing her3 or her9. E-J. Compared neurogenesis in control embryos (E,G,I) and embryos co-injected with the four gripNA antisense oligonucleotides directed against her3, 5, 9 and 11 transcripts (see Methods) (F,H,J). E,F. Expression of neurog1 (revealed by in situ hybridization against gfp in -8.4neurog1:gfp transgenic embryos) [62]: the majority of the MHB/r2 area is induced to express neurog1. G,H. The expression her8a is unaltered upon injection of the four gripNAs. I,J. Detection of GFP in -8.4neurog1:gfp embryos at 24 hpf (sagittal view, confocal projection of a 20 μm section of the neural tube). Ectopic neurons are formed ventrally across the midbrain-hindbrain boundary (position of the boundary indicated by the white bar), in a location normally devoid of GFP-positive cells (arrowheads). K,L. Summarized compared expression of her3, 5, 9 and 11 (K), also together with her8a (L). M-Q. Summary of the combined loss-of-function results for MH-expressed her genes, from Geling et al. [13] (M), Ninkovic et al. [22] (N), Bae et al. [11] (O,P) and the present paper (Q). Abbreviations: mid: midbrain, MN: presumptive motoneurons, r: rhombomere, r2l: lateral neurons of rhombomere 2, vcc: ventro-caudal cluster. EXPRESSION / LABELING:
|
|
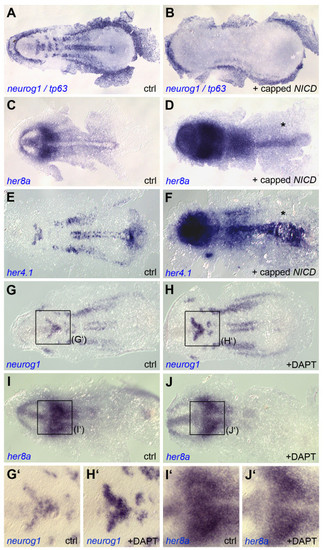
her8a expression is independent of endogenous Notch signaling in the early neural plate. Dorsal views of flat-mounted embryos analyzed at the 3-somite stage for the expression of the genes indicated. A-F. Ectopic Notch activation (injection of capped NICD mRNA) abolished neurog1 expression (B) and activates her8a (D) and her4.1 (F) compared to non-injected embryos (ctrl). G-J′. Notch blockade (incubation in the gamma-secretase inhibitor DAPT) increases neurog1 expression within proneural clusters (H) but leaves her8a expression intact (J) at early neural plate stages compared to embryos treated with a vehicle only (ctrl). G′-J′ are high magnification views of the areas boxed in G-J. EXPRESSION / LABELING:
PHENOTYPE:
|
|
her8a expression in the early neural plate is partially dependent on the expression of SoxB factors. Dorsal views of flat-mounted embryos analyzed at the 5-somite stage (A-F) and 3-somite stage (G-H) for the expression of the genes indicated (color-coded). A-F. her8a expression overlaps with that of the Sox family members sox2, sox3, sox19a, sox19b and sox21a, including the mid- and anterior hindbrain (red brackets). G-I. the simultaneous knockdown of sox2/3/19a/19b and 21a causes a reduction of her8a expression in the MH area of the early neural plate (white arrows). EXPRESSION / LABELING:
PHENOTYPE:
|
|
her13 expression highlights early neurogenesis domains during zebrafish embryonic development. Whole-mount in situ hybridization for her13 (blue staining) at the stages indicated (A-C and E are lateral views, D and F are dorsal views, all with anterior to the left). Note her13 expression in proneural clusters encompassing presumptive spinal interneurons (arrows) and sensory neurons (arrowheads), trigeminal ganglion neurons (asterisk), telencephalic (t) and epiphyseal (e) neurons. |
|
Neural plate patterning is unaffected upon blocking Her8a function. Whole-mount in situ hybridization for barhl2 (A,B), her5 (C,D) and her9 (E,F) in embryos injected with her8a capped mRNA (right column) compared to control embryos (left column). Dorsal views of whole-mount embryos are shown, anterior to the top. All three markers highlight defined neural plate territories (barhl2: transverse diencephalic domain; her5: prospective midbrain-hindbrain boundary; her9: prospective eye field, midbrain-hindbrain boundary and lateral rhombencephalic stripes, see Figure 5) and appear identically expressed in the wild-type and morphant neural plate. Abbreviations: d: diencephalon; e: eye field; mhb: midbrain-hindbrain boundary; sc: presumptive spinal cord. |
|
her8aMO1 and her8aMO2 have identical effects on neurog1 expression. Whole-mount in situ hybridization for neurog1 expression in embryos injected with her8aMO1 (B) or her8aMO2 (C) compared to control embryos (whole-mount views of 3 somite-embryos, anterior to the top). neurog1 expression is ectopically induced between the clusters of motoneurons and lateral neurons in rhombomeres 2 and 4 (blue arrowheads in B,C), a location normally devoid of neurog1 transcripts (white arrowheads in A). The phenotype is highly reproducible and identical in both morphant groups. |

Unillustrated author statements |


