
- Title
-
Heart chamber size in zebrafish is regulated redundantly by duplicated tbx2 genes
- Authors
- Sedletcaia, A., and Evans, T.
- Source
- Full text @ Dev. Dyn.

Both tbx2a and tbx2b are expressed in the primitive heart tube and transcripts become restricted to the atrioventricular canal (AVC) by 2 days postfertilization (dpf). A–D,G–I: Shown are representative embryos (n > 30 for each) analyzed by in situ hybridization to detect transcripts for tbx2a (A,B,G), tbx2b (C,D,H), or the AVC marker bmp4 (I). A–D: In addition to strong staining in the head, transcripts are readily detected in the primitive heart tube at 36 hpf (A,C, between the dashed lines) and subsequently in the AVC at 3 dpf (B,D, arrowheads marking the cushion tissue on either side of the AVC). E,F: Also shown for purpose of orientation are similarly staged myl7:gfp transgenic embryos that show the position of the heart tube at 36 hpf (E) and the AVC at 3 dpf (F). G–I: The restriction to the AVC can be seen starting already at 2 dpf, compared with bmp4. Control sense strand probes failed to generate any detectable signal under the identical conditions (not shown). EXPRESSION / LABELING:
|

A single morpholino targets a matched sequence in both tbx2 genes. A–F: Embryos were injected at the one-cell stage with 100 pg of tbx2a-gfp (A–D) or tbx2b-gfp (E,F) RNA which leads to strong fluorescence throughout the embryo at 24 hpf (A,C,E). This signal is completely blocked by co-injection of MO2a (B) or MO2ab (D,F). Note that the previously validated MO2b is not used in this assay, because it is a splice-blocker. However, MO2a does not block expression of the tbx2b-gfp transcript (not shown). For each sample n > 25. |
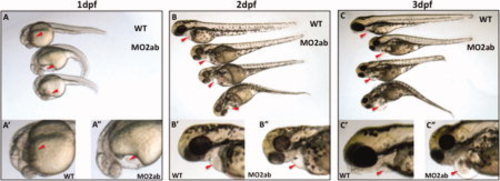
The tbx2ab morphants display pericardial edema by 1 days postfertilization (dpf) and develop a severe cardiomyopathy. A–C: Shown are representative wild-type (top) and morphant embryos at 1 dpf (A), 2 dpf (B), and 3 dpf (C) showing increasingly dysmorphic hearts. Panels below are closer views of wild-type (2) and morphant (22) embryos. Arrowheads mark the hearts. In each case n > 100 embryos, and essentially 100% of the tbx2ab morphants show pericardial edema by 1 dpf, which is rarely seen in the single morphants. PHENOTYPE:
|
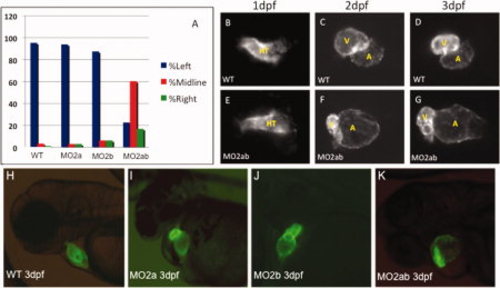
Chamber morphogenesis is disrupted in the tbx2ab morphants. A: Unlike single morphants, the tbx2ab double morphants show a heart tube jogging phenotype at 24 hours postfertilization (hpf). Wild-type and morphant embryos were evaluated at 24 hpf for the position of the primitive heart tube and scored as jogging left (normal, blue bars, right (green bars), or remaining midline (red bars). The Y axis indicates percentage of wild-type (WT), tbx2a morphant (MO2a), tbx2b morphant, or tbx2ab double morphant embryos. For each sample n = 50. B–G: Cardiac morphogenesis is visualized by imaging expression of the myl7:gfp transgenic reporter gene in wild-type (WT, top panels) or tbx2ab morphants (MO2ab, lower panels), at 1 dpf (B,E), 2 dpf (C,F) or 3 dpf (D,G). HT indicates the heart tube, whereas V marks the ventricle and A marks the atrium. Note that the heart tube shape is relatively normal at 1 dpf but is markedly altered in chamber morphology by 2 or 3 dpf. Each panel shows the heart of a representative embryo. For each sample, n > 100. The large atrium, small ventricle phenotype was scored in 110/172 tbx2ab morphants (64%). H–K: The tbx2ab double morphants have distinct alterations in chamber morphology. Shown are representative wild-type (A), tbx2a morphant (B), tbx2b morphant (C), or tbx2ab double morphant (D) embryos at 3 dpf in the myl7:gfp background. While hearts of the single morphants do not loop properly, due to emerging defects in atrioventricular canal (AVC) development at this stage, the chamber sizes, although variation was noted, are similar to those of wild-type embryos. In contrast, chamber sizes in the double morphant are significantly disturbed. Over 100 embryos were analyzed for each, taken from multiple independent experiments. PHENOTYPE:
|

Chamber sizes are altered in the tbx2ab morphants. Hearts were imaged in wild-type or tbx2ab double morphant embryos and the area of atrial and ventricular chambers was outlined and measured. A: The top panel shows the quantification from representative embryos at 1 days postfertilization (dpf), 2 dpf, or 3 dpf as indicated. Also as indicated, the measurement was in wild-type (WT) or morphant (MO), either in the heart tube (1 dpf, green), or for the atrium (A) or ventricle (V). In each case n is at least 10. B–F: Lower panels show representative images of wild-type and tbx2ab morphant hearts at 1 dpf (B,E), 2 dpf (C,F) and 3 dpf (D,G). In B and E the heart tube is outlined in green. In C, D, F, and G, yellow outlines the ventricle and green outlines the atrium. The ** indicates statistical significance compared with wild-type, according to Student′s t-test, P < 0.01. PHENOTYPE:
|

The number of cardiomyocytes in tbx2ab morphants compared with wild-type is not different in the expanded atrium, but is relatively decreased in smaller ventricles. Hearts were imaged using embryos from the myl7:dsRed-nuc reporter line and numbers of cardiomyocytes counted manually in Z-stack sections. A: The top panel shows the quantification of data for wild-type (WT) or double morphant embryos (Mo) at 2 days postfertilization (dpf) or 3 dpf as indicated. Also as indicated, the cells were counted in the heart tube (HT) at 2 dpf or specifically in the ventricle (V) or atrium (A) at 3 dpf. The ** indicates statistical significance compared with wild-type, according to Student′s t-test, P < 0.01. B–E: Lower panels show representative images of wild-type (WT) or tbx2ab morphants (MO) at 2 dpf (B,D) and 3 dpf (C,E). For each measurement n is at least 10. PHENOTYPE:
|
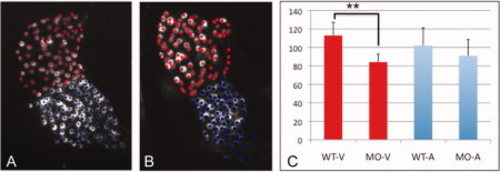
The tbx2ab morphant has fewer ventricular cardiomyocytes by 2 dpf. A,B: Shown are representative hearts from wild-type (A) or tbx2ab morphant (B) embryos derived from the myl7:dsRed-nuc reporter line. Flat-mounted embryos were chosen that displayed a clear constriction at the position of the presumptive AVC and were imaged by confocal microscopy. C: Based on this morphological distinction, individual cells were marked as ventricular (red) or atrial (blue) and quantified as shown in the chart. For each sample n = 4, and this was reproducible evaluating independent batches of embryos. The morphant ventricle (but not the atrium) has significantly fewer cardiomyocytes (indicated on the Y-axis) compared with wild-type (P < 0.01, according to Students t-test). PHENOTYPE:
|
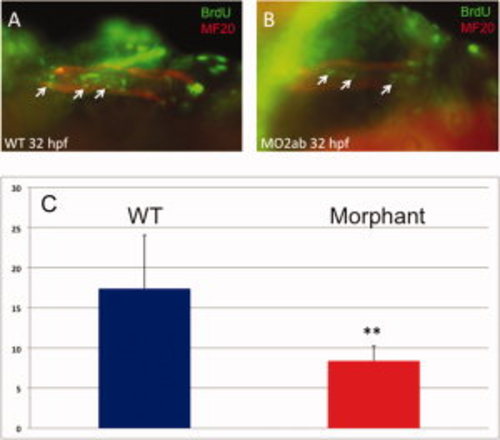
Cardiomyocyte proliferation is decreased in the tbx2ab morphants. Embryos were pulse-labeled with bromodeoxyuridine (BrdU), and after being fixed, were co-stained to detect BrdU+ cells (green) and MF20+ cardiomyocytes (red). Hearts were imaged, and the yellow (double positive) cells counted (examples indicated by the small arrows). A,B: The top panels show representative wild-type (A) and morphant (B) embryos at <32 hpf. C: The lower panel shows quantification of the average BrdU+ cardiomyocytes, in each case from several randomly chosen embryos, n = 5. The ** indicates statistical significance compared with wild-type, according to Student′s t-test, P < 0.02. This experiment was repeated several times and reproducibly showed significantly decreased relative levels of BrdU+ cardiomyocytes in morphants, although the actual number of double-labeled cells varies depending on the efficiency of BrdU labeling. PHENOTYPE:
|

Cardiomyocyte proliferation is not decreased in the atrium of tbx2ab morphants. Embryos were pulse-labeled with bromodeoxyuridine (BrdU), and after being fixed, were co-stained to detect BrdU+ cells (green) and S46+ atrial cardiomyocytes (red). Hearts were imaged and the yellow (double positive) cells counted (examples indicated by the small arrows). A,B: The top panels show representative wild-type (A) and morphant (B) embryos at <32 hpf. C: The lower panel shows quantification of the average BrdU+ cardiomyocytes, in each case from several randomly chosen embryos, n = 4. According to Student′s t-test, P = 0.13. The result is consistent with the fact that the atrium is not altered in cell numbers. PHENOTYPE:
|

Expression patterns for known chamber growth regulators are altered in the tbx2ab double morphant. A–F: Shown are representative embryos examined by in situ hybridization for expression of transcripts for myl7 to indicate cardiomyocytes, and for the growth factors nppa, or ndrg4 as indicated, in wild-type (A–C) and tbx2ab morphant (D–F) embryos at 2 days postfertilization (dpf). Arrows indicate the atrial expression domain and arrowheads mark ventricular expression domain. Note that transcript levels for ndrg4 are reduced in the presumptive ventricle. For each panel, n is at least 20. EXPRESSION / LABELING:
|

Expression levels for nppa and ndrg4 are significantly altered at 3 days postfertilization (dpf) in double tbx2ab morphants compared with single morphants. Shown are results from quantitative polymerase chain reaction (qPCR) assays (n is at least 4 for each sample) for single tbx2a (T2a), tbx2b (T2b) or double tbx2ab (T2ab) morphants at 24 hours postfertilization (hpf; 24h), 2 dpf (2d), or 3 dpf (3d), as indicated. Each sample was normalized to levels of transcripts derived from the 18s rRNA gene, and the average plotted relative to values obtained in control wild-type embryos (set at 1). The top panel shows quantification of nppa transcript levels, and the bottom panel shows measurements for ndrg4 transcripts. ** indicates that the nppa transcript values were significantly increased compared with wild-type for the tbx2a morphant at 24 hpf and for either single morphant and the double morphant at 3 dpf (P < 0.01), and that ndrg4 transcript levels are significantly decreased compared with wild-type for the tbx2b morphant at 24 hpf, both single and double morphants at 2 dpf (* indicates P < 0.05 for the double morphant), and only the double morphant at 3 dpf (P < 0.01). Importantly, *** above the brackets indicates that at 3 dpf, the double morphant is significantly increased for nppa transcript levels compared with either single morphant, and significantly decreased for ndrg4 compared with the tbx2b morphant (P < 0.05). Note that for the tbx2a single morphant there was more variation in ndrg4 transcript levels, but if anything they were higher, and are therefore clearly trending to the same conclusion (in this case, P < 0.08). Statistical significance was determined according to Student′s t-test. EXPRESSION / LABELING:
|

Some morphological disruption can be noted in the tbx2ab double morphants at 24hpf. Shown are representative embryos following in situ hybridization to detect transcript patterns for myl7 in cardiomyocytes of wildtype (A), the tbx2a morphant (B), the tbx2b morphant (C), or the tbx2ab double morphant (D) at 24 hpf. Bottom panels compare amhc expression in the presumptive atrium of wildtype (E) or tbx2ab morphant embryos (F), and vmhc expression in presumptive ventricle of wildtype (G) or tbx2ab morphant embryos (H). Arrows mark the presumptive atrial domain and arrowheads mark the presumptive ventricular domain. Note particularly the expanded atrial domain marked by the pattern of markers in the double morphants. For each panel n is at least 10 embryos. |

Chamber-specific progenitors appear to be normal at the pre-heart tube stage in tbx2ab morphant embryos. Shown are representative embryos (n is at least 10 for each) following in situ hybridization to detect transcript patterns for atrial-specific amhc and ventricular-specific vmhc at 19.5 hpf cardiac cone stage, comparing wildtype (WT) and double morphant (MO2ab) embryos, as indicated. It does not appear that progenitor domains are disturbed in the morphant embryos. |

Expression pattern for mppa transcripts levels are enhanced at 24 hpf in the tbx2a morphant. Shown are representative embryos following in situ hybridization analysis to detect the nppa transcript patterns. Compared to wildtype (A) the transcript levels appear enhanced in the tbx2a morphant (B) but not the tbx2b (C) or double morphant (D). |