- Title
-
A Mycobacterium marinum TesA mutant defective for major cell wall associated lipids is highly attenuated in Dictyostelium discoideum and zebrafish embryos
- Authors
- Alibaud, L., Rombouts, Y., Trivelli, X., Burguière, A., Cirillo, S.L., Cirillo, J.D., Dubremetz, J.F., Guérardel, Y., Lutfalla, G., and Kremer, L.
- Source
- Full text @ Mol. Microbiol.
|
Infection of zebrafish with the Mma tesA::Tn mutant: CHT injections. A. Fish survival was scored for each of three sets of injected embryos (n = 24). P < 0.0001 for MmaM versus tesA::Tn and MmaM versus RD1. These results are representative of three independent experiments. B. Whole embryo bacterial counts of MmaM, RD1 or tesA::Tn-infected embryos. Results are expressed as mean cfu per fish ± SEM from three independent experiments. Inoculates were MmaM (91 ± 40), RD1 (172 ± 130), tesA::Tn (144 ± 16). At 7 dpi, P < 0.01 for MmaM versus tesA::Tn and P < 0.05 for MmaM versus RD1. The symbols used are the same as those presented in (A). C. Overlay of fluorescent and transmission images of individual infected fish at 5 dpi. Three independent fish injected with each strain are shown. Scale bar is 250 μm. Note the red autofluorescence of the yolk (Y). D. Live imaging of individual infected macrophages at 5 dpi in MmaM, RD1 and tesA::Tn embryos using fluorescence and DIC microscopy at high magnification (×600). The latter contain much lower bacterial loads. |
|
Notochordal infections. A. Camera lucida sketch of the 31 h embryo (http://zfin.org). Injection sites are indicated. B. Individual embryos where sequentially injected at 30 hpf with the tesA::Tn_GFP strain in the blood flow and the tesA::Tn_mCherry strain in the notochord. Embryos were individually imaged to follow infection. Two representative embryos are depicted as overlays of phase contrast plus GFP fluorescence or RFP fluorescence at, respectively, 1 hpi, 2, 5 and 7 dpi. Both embryos died at 8 dpi. Scale bar is 250 μm. Autofluorescence of the yolk (Y) is seen in both GFP and mCherry channels. C. Survival curves of notochord-infected embryos. Approximately 93 ± 49 (three replicates, mean ± SD) cfu tesA::Tn mutants were injected at 30 hpf in the CHT (n = 24) or in the notochord (n = 59). Death was monitored on a daily basis. |
|
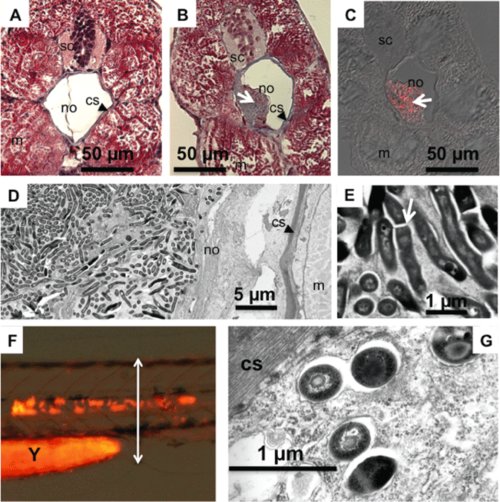
Histological and ultrastructural analyses of the tesA::Tn-infected notochord. A. Masson′s trichrome staining of a histological section from a non-infected notochord at 6 dpi. B. Same from a Mma tesA::Tn-infected notochord. C. TB Auramine-Rhodamine T staining of the section next to that in (B). Arrows indicate the focus of infection in (B) and (C). D, E and G. Transmission electron micrographs on an infectious focus in the infected notochord: (D) and (E) at 6 dpi; the arrow indicates a septum of division; (G) at 1 dpi. sc, spinal cord; m, muscular tissue; cs, collagen sheath surrounding the notochord. F. Micrograph at 1 dpi of the tesA::Tn_mCherry notochord infected embryo used for (G). The section displayed in (G) is depicted by the double-headed arrow. Magnification: ×10 000. Y, yolk. |
|
The tesA::Tn exhibits reduced virulence when injected in different compartments. Zebrafish embryos were injected at 30 hpf with MmaM (100 CFU) or tesA::Tn (150 CFU) inside the (A) otic vesicule or (B) hindbrain ventricule. Infection was followed up by fluorescence microscopy. For each compartment, one representative embryo injected with MmaM and two injected with tesA::Tn are shown. |


