
- Title
-
Dynamic analysis of BMP-responsive smad activity in live zebrafish embryos
- Authors
- Laux, D.W., Febbo, J.A., and Roman, B.L.
- Source
- Full text @ Dev. Dyn.
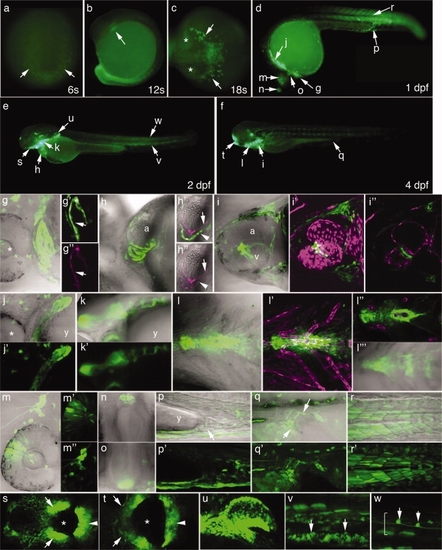
Developmental profile of pSmad1/5/8-mediated transcriptional activity in Tg(bre:egfp)pt510 embryos. In all images, green represents bre-driven EGFP expression. Magenta represents endothelial expression of Tg(fli1ep:dsRedEx)um13 or myocardial expression of Tg(-5.1myl7:nDsRed2)f2, as noted below. g-r, h2, h3, l32: Fluorescence/transmission overlays. a-f: Macro images. a: Six somites. Arrows point to tailbud. b: Twelve somites. Arrow points to myeloid progenitors. c: Eighteen somites. Asterisks denote eyes; arrows point to myeloid cells. d-f: Embryos at 1 (d), 2 (e), and 4 (f) dpf. Lettered arrows denote expression domains highlighted in correspondingly lettered panels below. g-w: 2D projections of confocal Z-series, except h2, h3, i3, and l3, which represent single optical sections extracted from the corresponding Z-series. Magnification, 400×. g-g3: Heart at 1 dpf. Asterisk denotes eye. g2 and g′′ are matched substacks showing EGFP/fli1ep:dsRedEx (overlay) and fli1ep:dsRedEx expression, respectively. Arrows denote endocardium. h-h3: Heart at 2 dpf. h2 and h′′ are matched optical sections of EGFP/ fli1ep:dsRedEx/-5.1myl7:nDsRed2 (overlay) and fli1ep:dsRedEx/-5.1myl7:nDsRed2. Arrows denote endocardium; arrowheads denote myocardium. i-i3: Heart at 4 dpf. i2 and i′′ show overlays of EGFP with fli1ep:dsRedEx, 2D projection and single optical section, respectively. j-j2: Pharyngeal arches, 1 dpf. Asterisk denotes eye. k,k2: Pharyngeal arches, 2 dpf. l-l32: Pharyngeal arches, 4 dpf. l2, l3: Overlays of EGFP with fli1ep:dsRedEx, 2D projection, and single optical section, respectively. l32: Substack of image shown in l. m-m3: Dorsal retina (m2) and trigeminal ganglion (m′′), 1 dpf. n: Pineal gland, 1 dpf. o: Hypothalamus, 1 dpf. p, p2: Ventral mesenchyme and cloaca (arrow), 2 dpf. q, q2: Cloaca, 4 dpf. Arrows delineate cloacal opening. r, r2: Somites, 1 dpf. s: Stomodeum, 2 dpf. Asterisk, presumptive mouth opening; arrows, maxillary process; arrowhead, mandibular process. t: Stomodeum, 4 dpf. Asterisk, open mouth; arrows, maxillary process; arrowhead, mandibular process. u: Pectoral fin bud, 2 dpf. v: Mesenchymal cells of the median finfold (arrows), 2 dpf. w: Spinal cord neurons (arrows), 2 dpf. Spinal cord is bracketed. a: Dorsoposterior view, posterior down. b, d-g, j, k, m, p-r, u-w: Lateral view, anterior left, dorsal up. c: Dorsal view, anterior left. h, i, l: Ventral view, anterior left, left up. n: Dorsal view, left to the right. o: Frontal view, left to the right. s, t: Frontal view, left up. a, atrium; v, ventricle; y, yolk. EXPRESSION / LABELING:
|
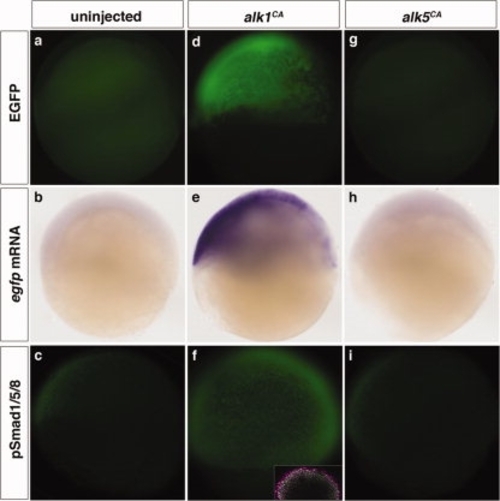
Expression of the bre:egfp transgene is responsive to changes in BMP type I receptor signaling. Embryos were left uninjected (a–c) or injected with 5 pg alk1CA mRNA (d–f) or 100 pg alk5CA mRNA (g–i) at the one- to two-cell stage and assayed at shield stage (6 hpf). a, d, g: Expression of bre-driven EGFP fluorescence in live embryos. b, e, h: Expression of bre-driven egfp mRNA assayed by in situ hybridization. c, f, i: Expression of pSmad1/5/8 assayed by immunofluorescence. Inset in f is pSmad1/5/8 (green)/DAPI (magenta) merge. Lateral views, animal pole up, dorsal right. Original magnification 80× except inset, 200×. |

Expression of the bre:egfp transgene is globally downregulated by small molecule inhibition of BMP type I receptor-mediated Smad phosphorylation. Embryos were treated with either 0.5% DMSO (a, e, i, k, m, o, q); 10 µM dorsomorphin (DM) (b, f, j, l, n, p, r); 10 µM DMH1 (c, g), or 200 µM SB-431542 (SB) (d, h) between 10 and 24 hpf and imaged shortly after washout. In all images, green indicates bre-driven EGFP expression. Brightfield (a-d) and fluorescent (e-h) images, lateral view, anterior left, 80× magnification. i-r: 2D projections of confocal Z-series showing EGFP and transmission overlays, 400× magnification. Expression domains shown include (i, j) retina; (k, l) hypothalamus (arrow); (m, n) heart (asterisk) and pharyngeal arches (arrow); (o, p) somites; and (q, r) cloaca (arrow). i, j, m-p: Lateral view, anterior left. k, l: Frontal view, left is right. q, r: Ventral view, anterior left. EXPRESSION / LABELING:
|
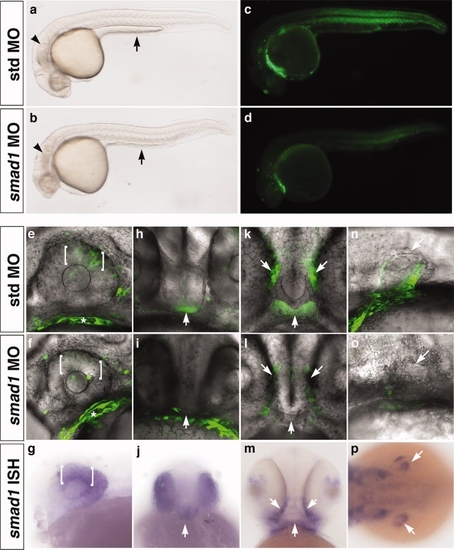
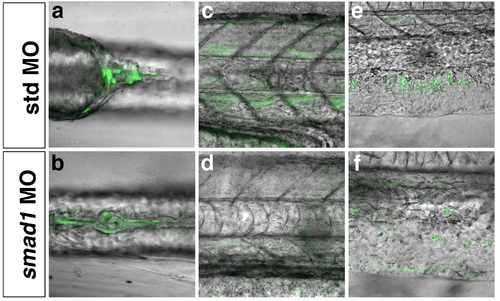
smad1 knockdown downregulates bre:egfp transgene expression in smad1-expressing domains. Embryos were injected with 2 ng standard control morpholino (a, c, e, h, k, n) or 2 ng smad1 morpholino (b, d, f, i, l, o) at the one- to two-cell stage. In all images, green indicates bre-driven EGFP expression. Brightfield (a, b) and fluorescent (c, d) images, 1 dpf, lateral view, anterior left, 80× magnification. Note defects in yolk extension (arrow) in smad1 morphant (b) versus control embryo (a). e, f, h, i, k, l, n, o: 2D projections of confocal Z-series showing EGFP and transmission overlays, 400× magnification. g, j, m, p: Expression of smad1 mRNA assayed by in situ hybridization. Expression domains shown include (e–g) dorsal retina (brackets), 1 dpf; (h–j) hypothalamus (arrow), 1 dpf; (k–m) stomodeum (arrows), 2 dpf; and (n–p) pectoral fin (arrows), 2dpf. e–g, n, o: Lateral view, anterior left. h–j: Frontal view, left is right. k–m: Ventral view, anterior up. p: Dorsal view, anterior left. |

Supporting Information Figure 1. Developmental profile of pSmad1/5/8-mediated transcriptional activity in Tg(bre:egfp)pt509 embryos. In all images, green indicates bre-driven EGFP expression. a–d: Macro images of Tg(bre:egfp)pt509 (a, c) and Tg(bre:egfp)pt510 (b, d) at 1 dpf (a, b) and 2 dpf (c, d). e–o: 2D projections of confocal Z-series, Tg(bre:egfp)pt509. Magnification, 400×. e, e2: Pineal gland, 1 dpf. f, f2: Hypothalamus, 1 dpf. g, g2: Stomodeum, 2 dpf. h, h2: Trigeminal ganglia, 1 dpf. i, i2: Pharyngeal arches, 1 dpf. j, j2: Somites, 1 dpf. k, k2: Spinal cord neurons, 2 dpf. Brackets denote spinal cord. l, l2: Mesenchymal cells of the median finfold, 2 dpf. m, m2: Cloaca, 1 dpf. n, n2: Heart, 1dpf. o, o2: Pectoral fin, 2 dpf. a–d, h–l, n, o: Lateral view, anterior left. e, f: Frontal view, left to the right. g: Ventral view, anterior up. m: Ventral view, anterior left. |
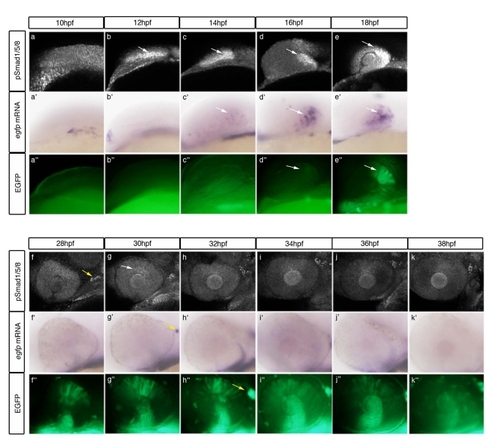
Supporting Information Figure 2. Temporal relationship between pSmad1/5/8 activity and EGFP fluorescence in Tg(bre:egfp) embryos. Embryos were collected every 2 hr between 10–18 hpf and 28–38 hpf and assayed for pSmad1/5/8 via immunofluorescence (a–k), 100×; egfp mRNA via in situ hybridization (a2–k2), 80×; and EGFP fluorescence (a22–k22), 80×. Results demonstrate a 4-hr delay between pSmad1/5/8 expression and EGFP fluorescence, and an 8–10-hr perdurance of EGFP after pSmad1/5/8 is lost. Green indicates bre-driven EGFP expression, 80× magnification. White arrows, dorsal retina; yellow arrows, trigeminal ganglia. All images lateral view, anterior left. |
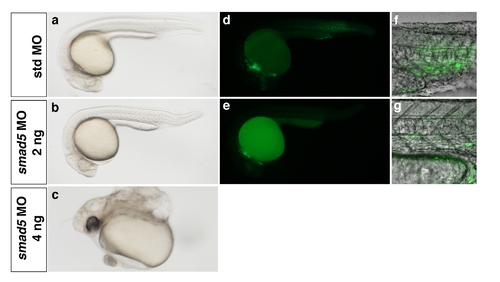
Supporting Information Figure 3. smad5 knockdown down-regulates bre:egfp transgene expression primarily in somites. Embryos were injected with 2 ng standard control morpholino (a, d, f), 2 ng smad5 morpholino (b, e, g), or 4 ng smad5 morpholino (c) at the one- to two-cell stage and imaged at 1 dpf. In all images, green indicates bre-driven EGFP expression. Brightfield (a, b, c) and fluorescent (d, e) images, lateral view, anterior left, 80× magnification. f, g: 2D projections of confocal Z-series showing somites, EGFP, and transmission overlays, 400× magnification. Lateral views, anterior left. PHENOTYPE:
|
Supporting Information Figure 4. smad1 knockdown downregulates expression of the bre:egfp transgene expression in additional domains. Embryos were injected with 2 ng standard control morpholino (a, c, e) or 2 ng smad1 morpholino (b, d, f) at the one- to two-cell stage. Images are 2D projections of confocal Z-series showing EGFP and transmission overlays, 400× magnification; focused on cloaca,1 dpf (a, b), somites, 2 dpf (c,d), and median finfold, 2 dpf (e, f). a, b: Ventral view, anterior left. c–f: Lateral view, anterior left. |

ZFIN is incorporating published figure images and captions as part of an ongoing project. Figures from some publications have not yet been curated, or are not available for display because of copyright restrictions. |