
- Title
-
Embryonic mesoderm and endoderm induction requires the actions of non-embryonic Nodal-related ligands and Mxtx2
- Authors
- Hong, S.K., Jang, M.K., Brown, J.L., McBride, A.A., and Feldman, B.
- Source
- Full text @ Development

Mesendoderm induction by Mxtx2. (A-X) Control gfp mRNA (50 pg) or mxtx2 mRNA (10 pg) was injected into whole zebrafish embryos (A-L), or Ctrl MO (8 ng) or Mxtx2 MO (2 ng) was injected into the yolk syncytial layer (YSL) (M-X), and embryos were fixed at 30% epiboly (4.7 hpf) and stained by whole-mount in situ hybridization (WISH) for the indicated markers. Animal pole views are shown. Fractions indicate the number of equivalent outcomes/number of embryos observed. See also Fig. S1 in the supplementary material. |
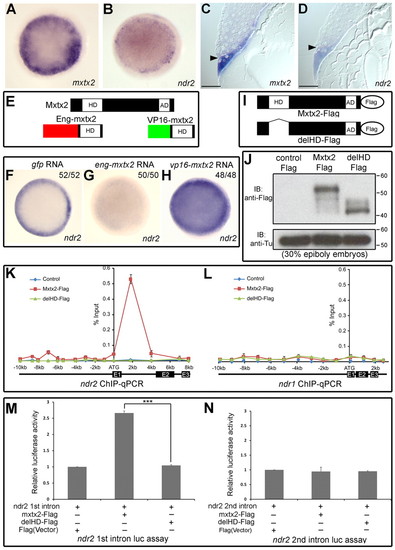
Mxtx2 activates ndr2 directly. (A-D) mxtx2/ndr2 co-expression at oblong (A,B; 3.7 hpf; animal pole views) and 30% epiboly (4.7 hpf; C,D, histological sections through margin and YSL) stages. Scale bars: 50 μm. Arrowheads (C,D) indicate the margin-YSL boundary. (E) Mxtx2 protein and derivative constructs. HD, homeodomain; AD, acidic domain. (F-H) Injection of 25 pg eng-mxtx2 or 25 pg vp16-mxtx2 mRNA alters ndr2 expression; 30% epiboly stage (4.7 hpf), animal pole views. Fractions indicate the number of equivalent outcomes/number of embryos observed. (I,J) Structure (I) and western blots showing expression (J) of tagged Mxtx2 (Mxtx2-Flag) and negative control (delHD-Flag) constructs. (K,L) Increased ChIP-qPCR signal for ndr2 intron 1, but not ndr1, in embryos injected with 25 pg mxtx2-flag mRNA. x-axes show positions of primers (see Table S1 in the supplementary material) relative to the three exons (E1-E3, black boxes) of ndr2 and ndr1. y-axes show percentage immunoprecipitated DNA relative to input DNA (see Materials and methods). Error bars indicate 1 s.d. based on two trials. (M,N) Increase in luciferase activity derived from a construct carrying ndr2 intron 1 (M), but not from a construct carrying ndr2 intron 2 (N), after co-transfection with an Mxtx2 expression vector. ***, P<0.0001; t-test. Error bars indicate 1 s.d. based on three trials. |

YSL expression of sox32 and ndr2 depends on Mxtx2. (A-L) Expression of the indicated marker genes at the 50% epiboly stage (5.3 hpf) in wild-type (WT) or MZoep zebrafish embryos after YSL injection of 8 ng Ctrl MO (A,C,E,G,I,K) or 2 ng Mxtx2 MO (B,D,F,H,J,L). (A-D) Sections through the margin and YSL of stained embryos. Arrowheads indicate the margin-YSL boundary. Fractions indicate the number of equivalent outcomes/number of embryos observed. Scale bars: 50 μm. |

Mxtx2/Ndr1 synergy underlies posterior mesoderm specification. (A-P) Ctrl MO (8 ng), Mxtx2 MO (2 ng) or Ndr1 MO (10 ng) were injected singly or in combination, as indicated, into the YSL of the following zebrafish embryos: WT (A,B,E,M,N), WT pre-injected with Ndr2 MO (F), MZoep (C,D), MZndr1 (G,H), Zndr1 (J) and their ndr1+/– siblings (I), and Mndr1 (K,L,O,P). Embryos in A-D were fixed at the 50% epiboly stage (5.3 hpf), whereas all others were fixed at the shield stage (6 hpf), and all were stained for ntla. Animal pole views are shown, with dorsal to the right. Fractions indicate the number of equivalent outcomes/number of embryos observed. |

Confinement of ntla transcripts to the embryonic margin and mxtx2 transcripts to the YSL. (B-D,F-H) Double fluorescence WISH was performed on WT zebrafish embryos at the 30% epiboly stage, with mxtx2 labeled in green, ntla in red and sox32 in red or green (as indicated by the text color). Overlapping expression appears in yellow. (A,E) Schematics indicating the embryonic regions (boxed) visualized in B-D and F-H, respectively. sox32 expression completely overlaps with mxtx2 in the YSL (C,G) and partially overlaps with ntla in the margin (D,H). By contrast, no overlap is seen between mxtx2 in the YSL and ntla in the margin (B,F). The thin yellow line in B and F, which is far narrower than a single cell, is an optical bleeding artifact. Arrowheads indicate the YSL-margin boundary. |

Unexpected roles for extraembryonic Ndr2 and Ndr1 in mesoderm induction. (A-L) Live (A-C,G-I) and RNA-stained (D-F,J-L) phenotypes of pharyngula stage (24 hpf) WT zebrafish embryos, Zndr1 embryos and their sibling controls and MZoep embryos after YSL injection of Ctrl MO (A,D), Ndr2 MO (G,H,J,K), Ndr2 MO combined with the Ndr1 ATG MO reported by Fan et al. (Fan et al., 2007; Feldman and Stemple, 2001) (ZFIN ID: MO4-ndr1) (B,E), or Ndr2 MO combined with the Ndr1 MO reported by Gore et al. (Gore et al., 2005) (ZFIN ID: MO2-ndr1) (C,F). Embryos in J-L were fixed and stained with two antisense probes: egr2b, which encodes a zinc-finger transcription factor and labels hindbrain rhombomeres 3 and 5; and desma, which encodes the intermediate filament protein Desmin A and labels muscles in the heart, trunk somites and tail somites. Arrows point to the anterior limit of the tail; arrowheads point to heart muscle staining by desma and r3 and r5 indicate rhombomere 3 and 5 staining by egr2b. Fractions indicate the number of equivalent outcomes/number of embryos observed. Siblings of the embryos in C and F are also shown in Fig. 7E and 7G, respectively. |

Endoderm and anterior mesoderm formation requires non-embryonic sources of nodal-related ligands. (A-H) Pharyngula stage (24 hpf; A,B,E,F, lateral views) and gastrula stage (7 hpf; C,D,G,H, animal pole views) phenotypes of WT and Mndr1 zebrafish embryos after YSL injection of 8 ng Ctrl MO or a combination of 10 ng Ndr2 MO and 10 ng Ndr1 MO. Embryos were fixed and stained with antisense probes against egr2b and desma RNAs (A,B,E,F; see Fig. 6 legend) and against RNA encoding the forkhead box transcription factor Foxa2, which labels gastrula stage endoderm and dorsal mesoderm (C,D,G,H). Black arrowheads indicate heart muscle staining by desma. Red arrowheads indicate dorsal mesoderm; the remaining foxa2 stain, where present, marks endoderm. Arrows indicate the anterior limit of the tail. Fractions indicate the number of equivalent outcomes/number of embryos observed. Siblings of the embryos in E and G are also shown in Fig. 6E and 6F, respectively. Insets in G and H show the distribution of fluorescently labeled MO in representative YSL injections. (I) Model of the developmental requirements for non-embryonic sources of Mxtx2, Ndr2 and Ndr1. The dashed line indicates a Nodal-independent pathway downstream of Mxtx2. Anterior mesoderm refers to the totality of head and trunk mesoderm. |

Recapitulation and rescue of epiboly defects in Mxtx2 morphants. (A-D) Embryos were injected at the 1-cell stage with (A) 8 ng Ctrl MO, (B) 1 ng Mxtx2 MO, (C) 2 pg mxtx2 mRNA + 1 ng Mxtx2 MO or (D) 2 pg mxtx2 mRNA alone, and documented by time-lapse in their chorions, as previously described (Pei et al., 2007; Schroter et al., 2008). Images show embryo morphologies at the time that control embryos reached 100% epiboly. (E) A total of 159 embryos that were time-lapsed or incubated in parallel were scored, revealing a highly significant degree of rescue. ***, P<0.0001; χ2 test. Pei, W., Noushmehr, H., Costa, J., Ouspenskaia, M. V., Elkahloun, A. G. and Feldman, B. (2007). An early requirement for maternal FoxH1 during zebrafish gastrulation. Dev. Biol. 310, 10-22. Schroter, C., Herrgen, L., Cardona, A., Brouhard, G. J., Feldman, B. and Oates, A. C. (2008). Dynamics of zebrafish somitogenesis. Dev. Dyn. 237, 545-553. |

Mxtx2 induction of ndr2 transcription is independent of protein synthesis. (A-I) Embryos were injected with 50 pg gfp RNA, 25 pg eng-mxtx2 RNA or 25 pg vp16-mxtx2 RNA as indicated and divided into untreated (A-C,G-I) or cycloheximide-treated (D-F) groups. Cycloheximide treatment (50 μg/ml) was initiated at the 64- to 128-cell stage (2 to 2.25 hpf), in order to leave sufficient time for the injected RNAs to be translated into protein after RNA injection at 0.5 hpf. All embryos were fixed when control embryos reached the 30% epiboly stage (4.7 hpf) and stained for ndr2 expression. The embryos in A-F were treated in parallel; the embryos in G-I were treated in parallel to the embryos shown in Fig. 2F-H. Animal pole views are shown throughout. Fractions indicate the number of equivalent outcomes/number of embryos observed. |

The phenotype resulting from synergistic removal of maternal and extraembryonic Ndrs is rescued by extraembryonic Ndr1. (A-B′) The YSL of Mndr1 embryos was co-injected with the same combination and doses of Ndr1 MO and Ndr2 MOs as in Fig. 7, but 50 pg of gfp RNA (A,A′) or 0.5 pg ndr1 RNA (B,B′) was also injected into the YSL. Embryonic phenotypes were scored and documented at the 24-30 hpf pharyngula stage. Lateral views are shown throughout, with magnified views in A′ and B′. Fractions in A and B indicate the number of equivalent outcomes/number of embryos observed. (C) As seen in B and B′, a substantial and highly significant degree of rescue was observed. ***P<0.0005, χ2 test with Yates correction. |