- Title
-
A chemical enterocolitis model in zebrafish larvae that is dependent on microbiota and responsive to pharmacological agents
- Authors
- Oehlers, S.H., Flores, M.V., Okuda, K.S., Hall, C.J., Crosier, K.E., and Crosier, P.S.
- Source
- Full text @ Dev. Dyn.
|
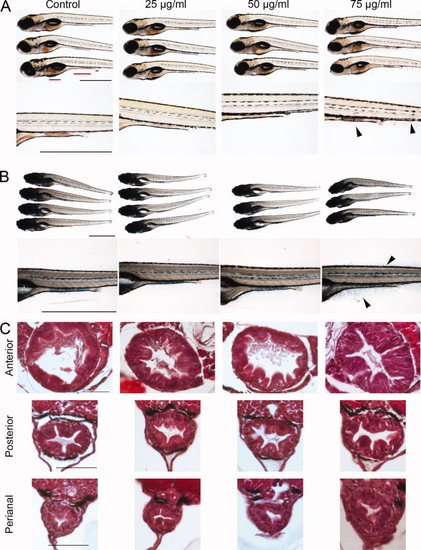
Histological analysis of trinitrobenzene sulfonic acid (TNBS) -induced enterocolitis. A: Transmitted light microscopy of 6 days postfertilization (dpf) larvae stained with Neutral Red. Red lines indicate regions sampled by transverse sectioning. Arrowheads in the bottom half of the panel indicate ectopic Neutral Red staining. B: Alcian blue stained 6 dpf larvae. Arrowheads in the bottom half of the panel indicate ectopic Alcian blue staining. C: Transverse sections stained with hematoxylin and eosin, anatomical locations are described in Panel A. Scale bar = 1 mm in A,B, 50 μm in C. PHENOTYPE:
|
|
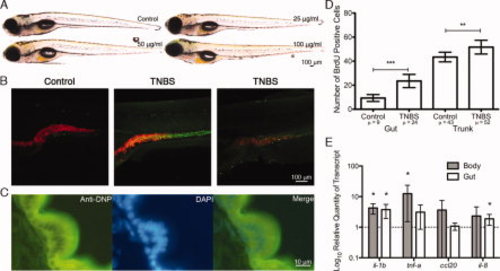
Trinitrobenzene sulfonic acid (TNBS) haptenization is concentrated to the intestinal tract and also causes extra-intestinal effects. A: Transmitted light microscopy of 6 days postfertilization (dpf) larvae exposed to increasing concentrations of TNBS. B: Confocal microscope images of whole mount immunofluorescent detection of TNBS hapenization by anti-dinitrophenyl (DNP) antibody in TG(ifabp:RFP) larvae (left: control, middle: high haptenization, right: low haptenization). C: Immunofluorescent detection of TNBS haptenization in a physical section of the intestinal bulb of a larva exposed to TNBS. Slides were counterstained with DAPI (4′,6-diamidine-2-phenylidole-dihydrochloride) to mark nuclei. D: Comparison of 5-bromo-2′-deoxyuridine (BrdU) incorporation in 6 dpf larvae following TNBS exposure. Counts were performed as described in the methods (n = 10, P values calculated by t-test, error bars represent a 95% confidence interval of the mean). E: Analysis of pro-inflammatory cytokine expression in 6 dpf larval dissected intestines and larval carcasses, measured by quantitative polymerase chain reaction (qPCR) after TNBS exposure and compared with controls. P values calculated by one-sided t-test against a hypothetic value of 1, error bars represent a 95% confidence interval of the mean, n = 3, pools of 15 larvae. *P < 0.05, **P < 0.01, ***P < 0.001. |
|
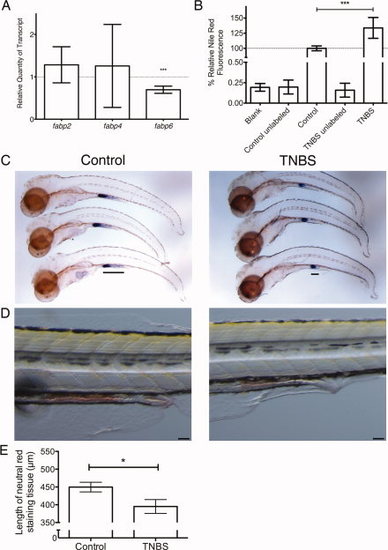
Changes to intestinal physiology caused by trinitrobenzene sulfonic acid (TNBS) exposure. A: Analysis of the fatty acid binding protein family expression measured by quantitative polymerase chain reaction (qPCR) after TNBS exposure and compared with control (n = 10, pools of 20 larvae, P value calculated by one-sided t-test against a hypothetical mean of 1). B: Nile Red fluorescence in larvae exposed to TNBS expressed as a percentage of signal detected in control larvae (n = 10, pools of 5 larvae, P value calculated by t-test). C,D: Comparison of mid-intestinal markers in control (left column) and TNBS-exposed (right column) larvae, in situ hybridization for fabp6 transcripts (C), bar indicates length of staining, and neutral red staining of highly endocytic epithelium (D). Scale bar represents 100 μm. E: Quantification of 6 days postfertilization (dpf) larval mid-intestinal length marked by neutral red staining. All error bars represent a 95% confidence interval of the mean. *P < 0.05, ***P < 0.001. |
|
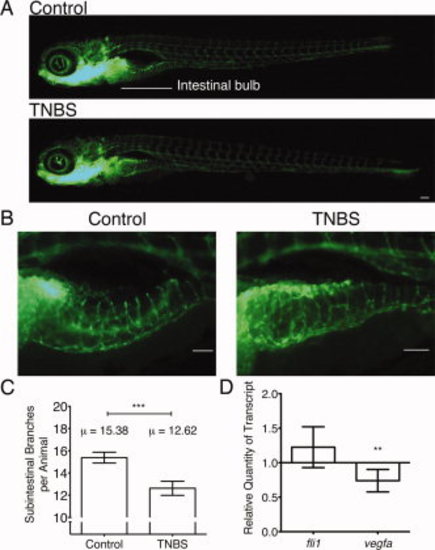
Intestinal vasculature is disrupted by trinitrobenzene sulfonic acid (TNBS) exposure. A: Comparison of vasculature in live 6 days postfertilization (dpf) TG(fli1a:EGFP)γ1 transgenic larvae imaged under epifluorescence with a GFP filter and (B) representative close up images. Scale bars represent 100 μm. C: Quantification of intestinal bulb vasculature at 6 dpf; mean numbers of subintestinal branches as indicated (n = 45). D: Quantitative polymerase chain reaction analysis of fli1 and vegfa transcription in 6 dpf larvae exposed to TNBS, shown relative to controls (RQ = 1; n = 10, pools of 20 larvae). All error bars represent a 95% confidence interval of the mean, P values calculated by t-test. **P < 0.01, ***P < 0.001. |
|
Zebrafish larvae mount a leukocytic response to trinitrobenzene sulfonic acid (TNBS) exposure. Left column is control and right column is TNBS-exposed. A: Comparison of neutrophil distribution in 6 days postfertilization (dpf) TG(mpx:EGFP)114. Larvae exposed to TNBS demonstrated a redistribution of leukocytes away from the CHT region. B: Comparison of confocal microscopy images of double transgenic TG(mpx:EGFP114, ifabp:RFP) larvae expressing EGFP in neutrophils and RFP in intestinal epithelial cells. C: Three-dimensional reconstruction of confocal microscopy data illustrating two angles. Scale bars in A and B represent 100 μm. CHT, caudal hematopoietic tissue. EGFP, enhanced green fluorescent protein. RFP, red fluorescent protein. EXPRESSION / LABELING:
|
|
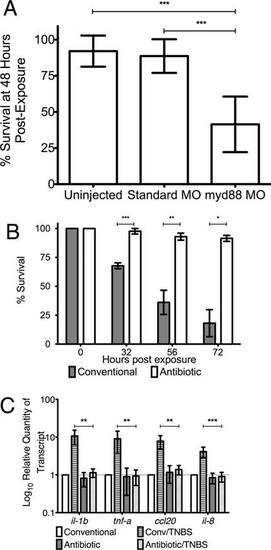
The Toll-like signaling adaptor molecule Myd88 and antibiotics protect against trinitrobenzene sulfonic acid (TNBS) -induced mortality. A: Comparison of Myd88 morphant survival with that of control larvae exposed to TNBS at a concentration of 75 µg/ml for 48 hr. Survival is expressed as a percentage of the original cohort (n = 5, groups of 20 larvae). B: Time course comparison of survival between larvae co-treatment with broad-spectrum antibiotics and control larvae exposed TNBS at a concentration of 100 µg/ml (n = 4, groups of 20 larvae). C: Quantitative polymerase chain reaction analysis of pro-inflammatory cytokine transcription in larvae exposed to TNBS with or without antibiotic administration (n = 5, pools of 20 larvae). All error bars represent at 95% confidence interval of the mean, P values calculated by t-test. *P < 0.05, **P < 0.01, ***P < 0.001. |
|
Histological analysis of TNBS-induced enterocolitis in 4 dpf larvae. (A) Transmitted light microscopy of 4 dpf larvae stained with Neutral Red. Red lines indicate regions sampled by transverse sectioning. Arrowheads in the bottom half of the panel indicate ectopic Neutral Red staining. Scale bar represents 1 mm. (B) Alcian blue stained 4 dpf larvae. Arrowheads in the bottom half of the panel indicate ectopic Alcian blue staining. Scale bar represents 1 mm. (C) Transverse sections stained with hematoxylin and eosin, anatomical locations are described in Panel A. Scale bar represents 50 μm. |
|
Histological analysis of TNBS-induced enterocolitis in 5 dpf larvae. (A) Transmitted light microscopy of 5 dpf larvae stained with Neutral Red. Red lines indicate regions sampled by transverse sectioning. Arrowheads in the bottom half of the panel indicate ectopic Neutral Red staining. Scale bar represents 1 mm. (B) Alcian blue stained 5 dpf larvae. Arrowheads in the bottom half of the panel indicate ectopic Alcian blue staining. Scale bar represents 1 mm. (C) Transverse sections stained with hematoxylin and eosin, anatomical locations are described in Panel A. Scale bar represents 50 μm. |
|
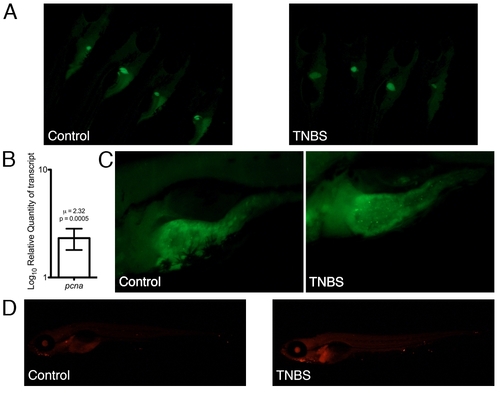
Intestinal effects of TNBS exposure. (A) NBD-cholesterol staining of control and TNBS-exposed larvae. (B) qPCR analysis of proliferating cell nuclear antigen (pcna) expression after exposure to TNBS. (C) Representative images of BrdU detection in the larval intestine. (D) Apoptosis detection in larvae by TUNEL staining. Epifluorescent imaging of control and TNBS-exposed larvae. Scale bar represents 1mm. |
|
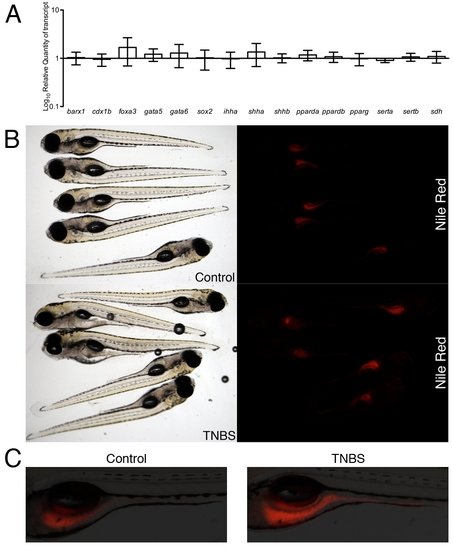
Intestinal and extra-intestinal effects of TNBS exposure. (A) A panel of gut differentiation markers were analyzed by qPCR after TNBS exposure and compared with controls (RQ=1) (n=7, pools of 20 larvae). Error bars represent a 95% confidence interval. (B) Epifluorescent live imaging of Nile Red fluorescence in 6 dpf control and TNBS-exposed larvae. Specimens were photographed with the same magnification, illumination and exposure settings to preserve signal intensity differences. (C) Magnified and overlayed specimens stained with Nile Red. |
|
Slices from confocal microscopy of 6 dpf control TG(ifabp:RFP, mpx:EGFP 114) larvae. |
|
Slices from confocal microscopy of 6 dpf TNBS-exposed TG(ifabp:RFP, mpx:EGFP 114) larvae. |
|
Antibiotics do not affect TNBS haptenizing activity. Transverse sections of 6 dpf larvae stained by immunofluoresence for TNBS hapentization. (A) Control (unexposed), (B) TNBS-exposed and (C) antibiotic treated and TNBS-exposed specimens were photographed with the same magnification, illumination and exposure settings to preserve signal intensity differences. Scale bar represents 50 μm. |
|
Analysis of leukocytes by FACS and mmp9 expression. (A) and (B) Representative forward (FSC) and side (SSC) scatter characteristics of labeled leukocytes from whole larvae. (C) FACS analysis of GFP positive cell counts in TG(lyzC:EGFP) 117 (n=6, pools of 20 larvae) and TG(mpx:EGFP)114 (n=3, pools of 20 larvae) transgenic lines. All error bars represent a 95% confidence interval of the mean, P values calculated by matched t-test. (D) Whole mount in situ hybridization analysis of mmp9 expression in control, TNBS exposed and tail regenerating (3 days post wounding) specimens. Red arrows indicate induced mmp9 expression. |
|
Methodology for defining leukocyte recruitment to the intestine. Red overlay in second row shows the limits used to define leukocytes recruited to the intestine in 6 dpf TG(mpx:EGFP)114 larvae. Representative pictures of different treatment conditions from Figure 7G. |

