
- Title
-
Islet1 selectively promotes peripheral axon outgrowth in Rohon-Beard primary sensory neurons
- Authors
- Tanaka, H., Nojima, Y., Shoji, W., Sato, M., Nakayama, R., Ohshima, T., and Okamoto, H.
- Source
- Full text @ Dev. Dyn.

The genetic locus of llb encodes the zebrafish orthologue of isl1. A, B: Morphology of the wild-type (A) and llb embryos (B) at 28 hpf. C: Genetic map of the llb locus. The llb locus was genetically mapped between the simple sequence-length polymorphism (SSLP) markers L546723 (0.21 cM) to G47922 (0.21 cM) on chromosome 5. D: Splicing defect of Isl1 caused by the llb mutation. Bracket, extra 10-bp insertion into the isl1 cDNA from the llb homozygous embryos; shaded letters, original splicing sites; red arrowheads, nucleotide where an A-to-G substitution has occurred; red letters, newly formed splicing acceptor site; green letters, wrong amino acid sequence. E: Amino acid sequence of Isl1 in the wild-type and llb embryos. Red arrowheads, exon-intron boundaries; green letters, wrong amino acids that were generated by the llb mutation. 182T is replaced with a stop codon (red arrow). F: Structure of Isl1. The llb mutation caused deletion of the C-terminal region of Isl1, which includes the homeodomain. G: The RT-PCR product containing the boundary between exons 3 and 4 of Isl. Black arrows, primer sites; red arrow, 10-base longer fragment that was only observed in the llb embryos. PHENOTYPE:
|
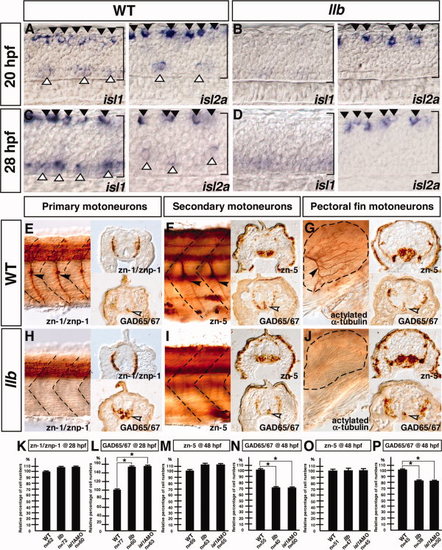
llb mutation affects the outgrowth of axons of all classes of motor neurons. A–D: Expression of isl1 and isl2a in the wild-type (A, C) and llb embryos (B, D) at 28 hpf. Lateral views with anterior at left. Brackets, spinal cord region; filled arrowheads, RB neurons; open arrowheads, primary motor neurons. E–J: Motor neuron and interneuron phenotypes of the wild-type and llb embryos. Primary motor neurons and GAD-positive interneurons at 28 hpf (E, H). Secondary motor neurons and GAD-positive interneurons at 48 hpf (F, I). Pectoral fin motor neurons and GAD-positive interneurons at 72 hpf (left) and 48 hpf (right) (G, J). Left panels are lateral views with anterior at left; right panels are transverse views. Filled arrowheads, each motor neuron; open arrowheads, ectopically induced GAD-positive neurons; broken lines, somite boundaries (E, F, H, I) and margin of the pectoral fin (G, J). K–P: Quantitative data for the motor neuron and interneuron phenotypes of the wild-type, llb, and isl1 morphant embryos. Data are mean ± SEM; n = number of sections; *P < 0.05, different from the wild-type embryos using 2-tailed paired Student′s t-test. EXPRESSION / LABELING:
PHENOTYPE:
|
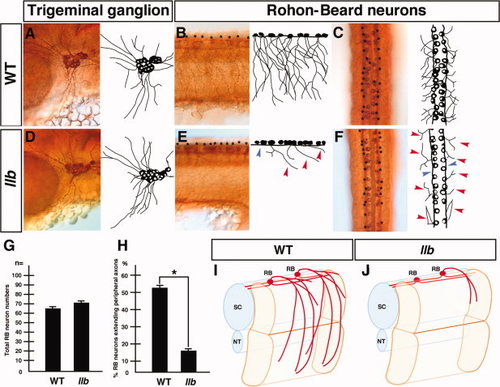
llb mutation selectively affects the outgrowth of the peripheral axons of RB neurons. A–F: Primary sensory neurons of the wild-type and llb embryos at 28 hpf. Tg neurons (A, D) and RB neurons (B, C, E, F) were stained by anti-acetylated α-tubulin antibody. Lateral views with anterior at left (A, B, D, E); dorsal views with anterior at top (C, F). Red arrowheads, peripheral axons; blue arrowhead, central axons of RB neurons; asterisks, cell bodies of RB neurons. G, H: Quantitative data for the phenotypes of RB neurons in the wild-type and llb embryos. Data are mean ± SEM; n = 10; *P < 0.05, different from the wild-type embryos using 2-tailed paired Student′s t-test. I, J: Schematic views of the axial structure of the wild-type (I) and the llb embryos (J). NT, notochord; RB, Rohon-Beard neuron; SC, spinal cord. |

llb mutation causes the null phenotypes of isl1. A–D: Primary sensory neurons of the embryos injected with 2 μg/μl of isl1 AMO (A, B) and 2 μg/μl of isl1 control AMO (C, D) at 28 hpf. Tg neurons (A, C) and RB neurons (B, D) were stained by anti-acetylated α-tubulin antibody. E, F: The peripheral axons of RB neurons in the embryos injected with 2 μg/μl of isl1 AMO and 28 ng/μl of isl1 mRNA (E), or 28 ng/μl of isl1 mRNA, which has the llb mutation (F), at 28 hpf. All panels are lateral views with anterior at left. G, H: Quantitative data for the rescue experiments. Data are mean ± SEM; n = 10; *P < 0.05, different from the control embryos using 2-tailed paired Student′s t-test. PHENOTYPE:
|

llb mutation causes a reduction in dpysl3 expression in RB neurons. A–F: Expression of plxna4, ntrk3a (trkC1), and dpysl3(crmp4) in the wild-type (A–C) and llb embryos (D–F) at 28 hpf. Lateral views with anterior at left. Brackets, spinal cord region; filled arrowheads, RB neurons. G, H, J, K: Expression of isl1 and dpysl3 in Tg neurons in the wild-type (G, H) and llb embryos (J, K) at 24 hpf. Broken lines, isl1-positive (G) or dpysl3-positive (H, K) Tg ganglia. Lateral views with anterior at left. I, L: Expression of sema3d in wild-type (I) and llb embryos (L). Broken lines, margin of the spinal cord. Dorsal views with anterior at top. EXPRESSION / LABELING:
|

Loss of function of dpysl3 selectively affects the outgrowth of the peripheral axons of RB neurons. A–H: Phenotypes of RB neurons in the llb embryos, dpysl3 morphants, and sema3d morphants at 28 hpf. Lateral views with anterior at left (A–D). Dorsal views with anterior at top (E–H). Asterisks indicate the cell bodies of RB neurons. I–L: Contactin 2 (TAG-1)-positive central axons (arrows) at 28 hpf. Broken lines indicate the margin of the spinal cord. Lateral views with anterior at left. M–P: zCREST2:GFP-labeled RB neurons at 28 hpf. Broken lines indicate the margin of the spinal cord. Arrows indicate the central axons. Arrowheads in (M) indicate the peripheral axons. Lateral views with anterior at left. Q: Quantitative data for the dpysl3 morphants that were rescued by co-injection of AMO-resistant (AMO-r) dpysl3 mRNA. Data are mean ± SEM; n = 10; *P < 0.05, different from the 5 μg/μl dpysl3 AMO-injected embryos, using 2-tailed paired Student′s t-test. R–T: Quantitative data for phenotypes of RB neurons. Data are mean ± SEM; (n = 10, R, S)(n=5, T); *P < 0.05, different from the wild-type embryos; **P < 0.05, different from the llb embryos, using 2-tailed paired Student′s t-test. |

Dpysl3 is ubiquitously expressed in both the central and peripheral axons of RB neurons. A–F: Localization of Dpysl3-mCherry (A–C) and mCherry (D–F) (red) in the cell body of RB neurons. RB neurons were visualized using zCREST2 HSP70:GFP transgenic line (green). Arrows, nuclei of RB neurons. Dorsal views with anterior at top. G–I: Localization of Dpysl3-mCherry in RB neurons (red) at 28 hpf. RB neurons were visualized using zCREST2 HSP70:GFP transgenic line (green). Red arrowheads, central axon; blue arrowheads, peripheral axons. Lateral views with anterior at right. EXPRESSION / LABELING:
|

Deletion analysis of the upstream genomic sequence of zebrafish orthologue of dpysl3. A: Deletion series of dpysl3:GFP and zCREST2-HSP70:mCherry constructs. The red bars in the dpysl3 upstream genomic sequences indicate the conserved Isl1 recognition site (CTAATG). Red asterisks, induced nucleotide substitution. B: Expression of GFP and mCherry in RB neurons at 28 hpf. Asterisks, RB neurons that expressed both GFP and mCherry. C: Quantitative data for expression of GFP in the mCherry-positive RB neurons. |

The interaction between Sema3d and Dpysl3 is required for the outgrowth of the peripheral axons of RB neurons. A–G: Phenotypes of the peripheral axons of RB neurons in the morphants at 28 hpf. RB neurons were stained by anti-acetylated α-tubulin antibody. Lateral views with anterior at left. H, I: Quantitative data for phenotype of RB neurons in the morphants. Data are mean ± SEM; n = 10; *P < 0.05, different from the suboptimal dose of sema3d or dpysl3AMO injected embryos, using 2-tailed paired Student′s t-test. PHENOTYPE:
|