
- Title
-
Neural and Synaptic Defects in slytherin, a Zebrafish Model for Human Congenital Disorders of Glycosylation
- Authors
- Song, Y., Willer, J.R., Scherer, P.C., Panzer, J.A., Kugath, A., Skordalakes, E., Gregg, R.G., Willer, G.B., and Balice-Gordon, R.J.
- Source
- Full text @ PLoS One
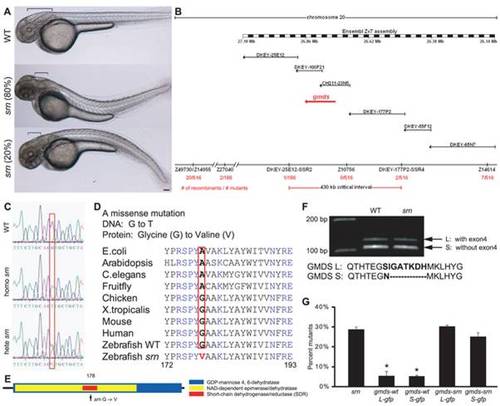
A. External srn phenotypes at 48 hpf include a bent tail (80% dorsal (534 embryos, 8 carrier pairs)) and aberrant hindbrain formation (brackets). Scale bar = 100 μm. B. Genetic and physical map of the srn locus (red arrow), including SSLP markers, number of recombinants, BAC clones and megabase positions from Ensembl Zv7. C, D. In srn, Gmds mutation is G to T (C, red box) resulting in a Glycine to Valine conversion (D, red box). GMDS amino acid sequence is highly conserved. E. Schematic of srn mutation in the short-chain dehydrogenase/reductase (SDR) domain of GMDS. F. Two splice variants exist in gmds mRNA, with (gmds-L, 377 aa) or without (gmds-S, 370 aa) exon 4. Gmds alternative splicing is not altered in srn mutants. G. Injection of gmds mRNA rescues srn mutants. Compared to uninjected embryos, 28.6±1.2% of embryos were mutant when scored by external phenotypes (3413 embryos, 27 carrier pairs). In embryos injected with WT gmds-gfp mRNA, the percentage of mutants scored by external phenotypes was significantly decreased, to ca. 5% (gmds-wtL-gfp 5.4±2.5%, 401 embryos, 3 carrier pairs; gmds-wtS-gfp 5.1±0.6%, 587 embryos, 4 carrier pairs; one-way ANOVA, followed by Dunn′s pairwise comparison, p<0.05). The percentage of embryos with mutant external phenotypes was unchanged in embryos injected with mutant gmds-gfp mRNA (gmds-srnL-gfp 30.2±0.9%, 387 embryos, 3 carrier pairs; gmds-wtS-gfp 25.1±1.9%, 516 embryos, 4 carrier pairs). This mRNA rescue experiment confirms that gmds is the gene responsible for srn mutation. PHENOTYPE:
|
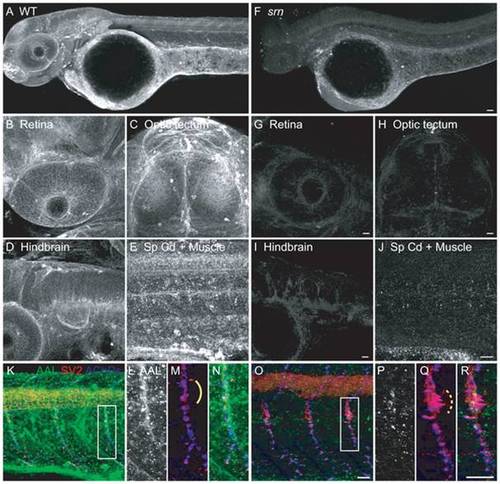
A. AAL staining of WT embryos at 48 hpf showed that protein fucosylation is present throughout the embryo (10–15 embryos/2–3 adult pairs for all analyses). B–E. Protein fucosylation is prominent in several neural tissues including retina (lateral view), optic tectum (dorsal view), hindbrain (lateral view), spinal cord (lateral view) and neuromuscular synapses (lateral view of axial muscle). F. Protein fucosylation is dramatically reduced in srn mutants. Scale bar = 20 μm. G–J. Reduced protein fucosylation in several neural tissues. Scale bar = 20 μm. K. Protein fucosylation at neuromuscular synapses in WT embryos at 48 hpf, as shown by the colocalization of AAL staining (green) with markers for presynaptic axons and nerve terminals (SV2, red) and postsynaptic AChR clusters (α-bungarotoxin, blue). L–N. Higher magnification of boxed region in K. O. Protein fucosylation is reduced at srn neuromuscular synapses. Scale bar = 20 μm. P–R. Higher magnification of boxed region in O. Synapse area is significantly increased in srn mutants, e.g., at the choice point (compare dashed bracket in Q to solid bracket in M). Scale bar = 20 μm. PHENOTYPE:
|

A. External srn phenotypes including bent tail and aberrant hindbrain (bracket) are rescued by GDP-fucose supplementation (3 embryos). Scale bar = 100 μm. B. GDP-fucose injection significantly reduced the percentage of mutants from 28.6±1.2% to 8.4±2.7% (576 embryos, 4 carrier pairs; Student′s test, p<0.0001). C. After GDP-fucose supplementation (2 embryos), protein fucosylation as assessed by AAL staining at 48 hpf is rescued throughout srn embryos, to levels similar to those in WT embryos. Scale bar = 100 μm. |

A, B. Secondary motor neuron cell body number and patterning assayed with Zn5 immunostaining (18 embryos/3 carrier pairs for each). B. Higher magnification of boxed region in A. At 48–72 hpf, Zn5+ cell number is similar in srn and WT (Fig. S4), but the patterning of these cells is aberrant in srn embryos. Zn5+ cells are clumped in srn mutants (dashed blue bracket) compared to WT embryos (solid blue bracket). dla mutants do not have defects in Zn5+ cell number (Fig. S4), but have aberrant Zn5+ cell patterning as in srn mutants (dashed blue bracket). mib mutants and high dose DAPT treated embryos have aberrant Zn5+ cell number (Fig. S4) and patterning (dashed blue bracket). Medium dose DAPT treated embryos show aberrant Zn5+ cell patterning defects (dashed blue bracket), without an obvious change in cell number (Fig. S4), as in srn. The dorsal projecting nerve is absent in srn mutants (dashed pink oval) compared to WT (solid pink oval), consistent with increased cell death; this nerve is present in dla and des mutants (solid pink oval); des also has other motor axon pathfinding errors. In mib mutants and high and medium dose DAPT treated embryos, the dorsal projecting nerve is absent (dashed pink oval). C. In WT embryos at 48 hpf, two Mauthner neurons are present (dorsal view of hindbrain). In srn, des, dla, mib and high dose DAPT treated embryos, Mauthner neuron number is increased (dashed red brackets), with the largest increase observed in mib (12 embryos, 3 carrier pairs for each). D. In the spinal cord, the number of GFAP+ glial cells is reduced in srn and dla mutants and medium dose DAPT treated embryos compared to WT and des embryos at 48–72 hpf. In mib and high dose DAPT treated embryos, a more dramatic reduction is observed. The GFAP labeling that remains in mib mutants is likely to be in Rohon-Beard neurons dorsally and secondary motor neurons ventrally and is easily separated morphologically and based on its location from glial processes, thus does not interfere with analyses of glial defects (18 embryos, 3 carrier pairs for each). E. Overlay showing both the Zn5 and GFAP staining in the spinal cord. Scale bars = 40 μm. EXPRESSION / LABELING:
PHENOTYPE:
|
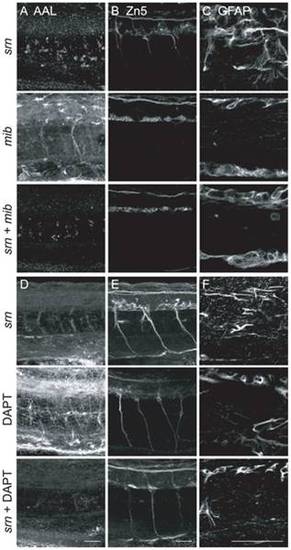
A–C. mib excludes srn phenotypes. A. AAL staining is reduced in srn and srn + mib double mutants, but not in mib. B. srn + mib double mutants showed reduction of secondary motor neurons, more severe than srn but similar to mib alone. C. srn + mib double mutants have reduced GFAP+ glia, more severe than srn, but similar to mib alone (15 embryos, 2 carrier pairs for each). Scale bar = 40 μm. D–F. DAPT treatment excludes srn phenotypes. D. AAL staining is reduced in srn and srn mutants treated with DAPT, but not in DAPT treated embryos. E. srn mutants treated with DAPT showed reduction of secondary motor neurons, more severe than srn but similar to DAPT treated embryos. F. srn mutants treated with DAPT showed reduction of GFAP+ glia, more severe than srn, but similar to DAPT treated WT embryos (10 embryos, 2 carrier pairs for each). Scale bar = 40 μm. EXPRESSION / LABELING:
PHENOTYPE:
|
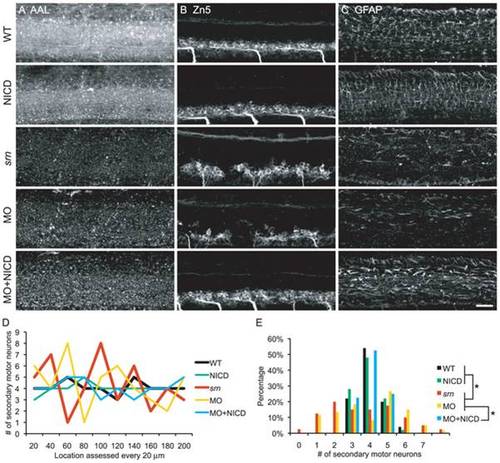
A. AAL staining is reduced in srn, gmds morphants and gmds morphants overexpressing NICD, but not in WT embryos or WT embryos overexpressing NICD. B. WT and WT overexpressing NICD had normal Zn5+ cell patterning. srn and gmds MO showed Zn5+ cell patterning defects which was rescued by NICD overexpression in gmds morphants. C. WT and WT overexpressing NICD had normal GFAP+ glia cells in spinal cord. srn and gmds morphants had reduced GFAP+ glia cells, rescued by NICD overexpression in gmds morphants (>10 embryos in each experiment). Scale bar = 40 μm. D–E. Quantification of Zn5+ cell patterning defects. There are 3–5 Zn5+ cells every 20 μm in WT, WT overexpressing NICD and gmds MO overexpressing NICD; compared to 1–8 in srn and gmds MO embryos. D, data from a representative embryo; E, distribution of all embryos (4–6 embryos; Kolmogorov-Smirnov test, * p<0.05). EXPRESSION / LABELING:
PHENOTYPE:
|
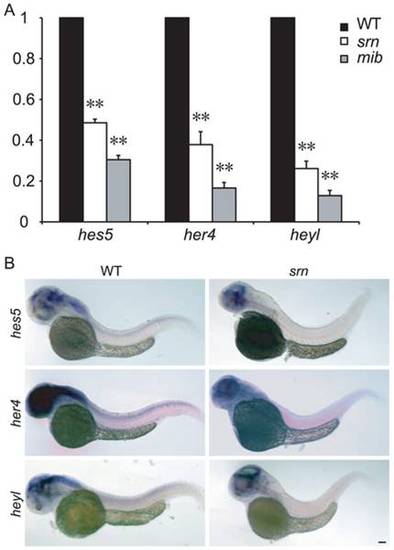
A. qRT-PCR assessment of fold change in hes5, her4 and heyl expression in WT, srn and mib mutant embryos at 48 hpf, normalized to β-actin1. hes5, her4 and heyl expression is dramatically reduced in srn, similar to those in mib, but to a lesser extent. (3–5 experiments, 20 embryos each, one-way ANOVA, Bonferroni′s Multiple Comparison Test, ** p<0.001, * p<0.5). B. hes5, her4 and heyl in situ hybridization at 48 hpf confirm reduced expression in the brain and spinal cord in srn mutants compared to WT (>30 embryos for each). Scale bar = 100 μm. EXPRESSION / LABELING:
|
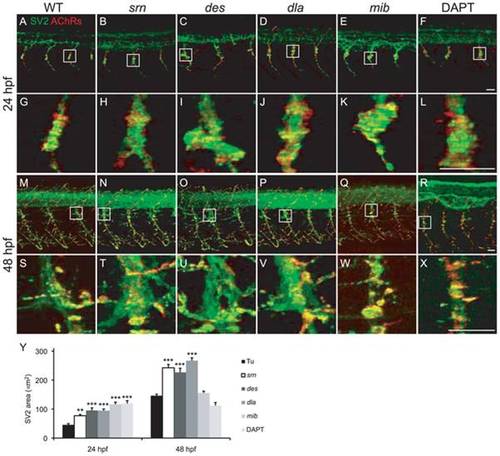
A–X. Presynaptic terminals (green) and postsynaptic AChR clusters (red) in 24 and 48 embryos from WT (A, G, M, S), srn (B, H, N, T), des (C, I, O, U), dla (D, J, P, V), mib (E, K, Q, W) and DAPT treated embryos (F, L, R, X). Boxed regions are shown at higher magnification at 24 (G–L) and 48 hpf (S–X; 3 hemisegments in each of 20 embryos, 3 carrier pairs for each). Scale bar = 20 μm. Y. Presynaptic terminal, axon and synapse area at the choice point was significantly increased in all mutants, except in mib and DAPT treated embryos at 48 hpf, compared to WT (one-way ANOVA, Bonferroni′s Multiple Comparison Test, ** p<0.01, *** p<0.001). |
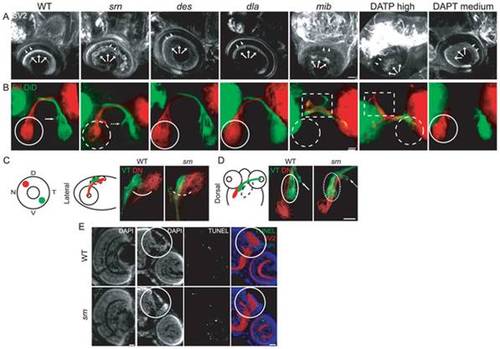
A. In srn mutants at 72 hpf, the OPL (arrowheads) and IPL (arrows) are disorganized; this is not seen in des or dla mutants. In mib mutants, retinal ganglion and other cells die, resulting in decreased retina neuropil (rightmost panel; 8 embryos, 2 carrier pairs for each). Scale bar = 20 μm. B. In srn mutants, retinal ganglion cell axons grow out to the optic chiasm and to optic tectum, but axon branches are aberrantly distributed within tectum (dashed white circle) and medial axon projections are shifted towards the midline (compare solid arrow and dashed arrow). Virtually all retina was dye labeled, and the labeling pattern was consistent across experiments, thus these defecs aren′t due to incomplete dye uptake or labeling in srn mutants. These phenotypes are not present in des or dla mutants, and are also different from mib mutants, in which retinal ganglion cell axonal projections to optic tectum are dramatically reduced, as a consequence of retinal ganglion cell death. Mib mutants also displayed axon pathfinding errors at the optic chiasm; axons branched anterior to the optic chiasm (dashed square), while branching within tectum was dramatically reduced (dashed white circle; 15 embryos, 3 carrier pairs for each). Scale bar = 20 μm. C, D. Topographic mapping of axon projections to optic tectum; dorsonasal (DN) and ventrotemporal (VT) axons were with DiI or DiD. DN and VT axon projections within tectum are aberrant in srn mutants, as is overlap dorsally (C) and laterally (D; 8 embryos, 2 carrier pairs for each). Scale bar = 20 μm. E. In retina and optic tectum (white circle), the overall cellular lamination pattern as assessed by DAPI staining is grossly normal in srn mutants (compare bottom left panels, WT and srn). TUNEL staining showed that increased cell death was observed in the retina of srn mutants compared to WT embryos at 72 hpf; no difference in cell death in the optic tectum was observed in srn mutants compared to WT embryos at 72 hpf (color overlay, right most panels; 2–3 embryos, 1 carrier pair). Scale bar = 20 μm. |
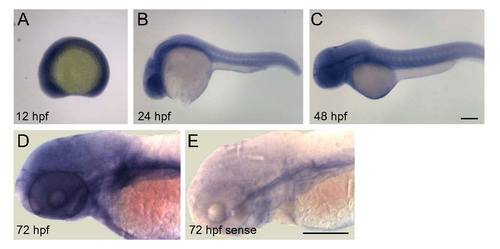
Gmds mRNA localization by in situ hybridization in wild type zebrafish embryos from 12 to 72 hpf. In situ hybridization was performed as described previously (Panzer et al., 2005), with anti-sense (A–E) gmds probe; sense probe was used as a control (F). Several hundred embryos from several carrier pairs were used from 6 to 72 hpf. A. From 6 to 12 hpf, gmds transcripts are expressed throughout the embryo. B. By 24 hpf, gmds transcripts are highly expressed in the CNS and are also expressed in somites at lower levels. C, D. Gmds mRNA expression is present in the CNS at 48 (C) and 72 (D) hpf, with transcripts more abundant in brain than spinal cord. |
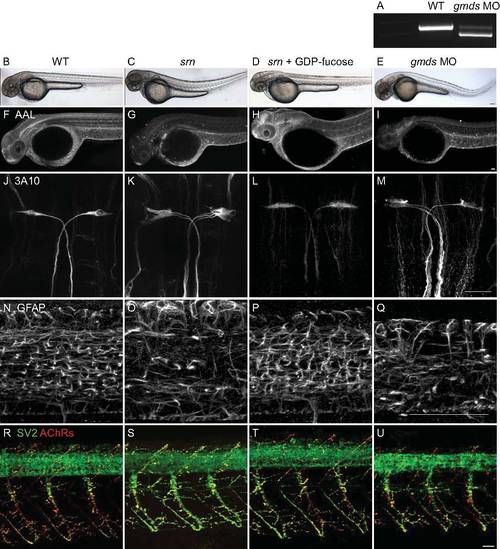
GDP-fucose rescue of srn and morpholino knockdown of gmds. A. RT-PCR showed >80% of gmds transcript was mis-spliced after gmds morpholino (4 ng) injection. B–E. External phenotypes in srn and gmds morphants (E) include tail bend (compare B, wild type with C, srn) which is rescued after GDP-fucose supplementation (D). F–I. srn (G) and gmds morphants (I) showed reduced AAL staining compared to wild type (F) which is rescued after GDP-fucose supplementation (H). J–M. srn (K) and gmds morphants (M) showed increased Mauthner neuron number compared to wild type (J) a phenotype that is rescued after GDP-fucose supplementation (L). N–Q. srn (O) and gmds morphants (Q) showed reduced GFAP+ glia in the spinal cord compared to wild type (N), a phenotype that is rescued after GDP-fucose supplementation (P). R–U. srn (S) and gmds morphants (U) showed increased neuromuscular synapses compared to wild type (R), a phenotype that is rescued after GDP-fucose supplementation (T). Scale bar = 40 μm. In each experiment, at least 10 srn, normal siblings, gmds morphants or GDP-fucose rescued srn mutant embryos were assessed at 48 hpf. These results show that GDP-fucose rescues external and neural defects in srn mutants and that gmds knockdown by morpholino phenocopies srn phenotypes. Together, these further support the conclusions that gmds is the gene mutated in srn, that the fucose metabolism pathway is deficient in srn mutants, and that the resulting lack GDP-fucose is the cause of the srn mutant phenotypes, rather than the accumulation of the substrate, GDP-mannose. |

Immunostaining of Zn5, Islet1/2 and GFAP, and quantification of Zn5+ cell patterning defects. A. At 24 hpf, Islet1/2 staining is increased in srn mutants compared to WT embryos, in primary motor neurons and Rohon-Beard neurons, identified based on their morphology and location in the spinal cord. Dashed lines indicate segment boundaries. B. At 48 hpf, in WT embryos, Zn5+ cells are also Islet1/2+. In srn mutants, Islet1/2 expression is reduced and majority of Zn5+ cells are not Islet1/2+. C. Zn5 and GFAP immunostaining in WT and srn mutants at 48 hpf, showing the spatial relationship between these markers. D. GFAP staining in HuC:GFP embryos at 48 hpf, showing the spatial relationship between neuron cell bodies and GFAP+ processes in the spinal cord. Scale bar = 40 μm. E–H. Quantification of Zn5+ cell patterning defects. There are 3–5 Zn5+ cell at every 20 μm interval in WT and des mutants, 1–9 in srn, dla mutants and medium dose DAPT treated embryos, and 0–3 in mib and high dose DAPT treated embryos, consistent with clumping and gaps in the spinal cord. Data from a representative embryos is shown in E and G. The distribution of all embryos is shown in F and H (4–9 embryos for each; Kolmogorov-Smirnov test, p<0.05). |

Reduction in Notch-Delta signaling accounts for some srn phenotypes in the retina. A. Retina patterning was examined with immunostaining using antibody Zn5 at 72 hpf. Retina cell patterning appears grossly normal in srn, des, dla and medium dose DAPT treated embryos, but in mib and high does DAPT treated embryos retinal ganglion cell number is reduced, probably due to increased cell death, as previously reported (Bernardos et al., 2005) (8 embryos, 2 carrier pairs were examined). Scale bar = 40 μm. B. Glial cells in the retina were examined after immunostaining with anti-GFAP antibody. In the retina, the number of radially oriented GFAP+ Muller cells is decreased in srn and mib and medium dose DAPT treated embryos, but not in des or dla (8 embryos, 2 carrier pairs were examined). Scale bar = 40 μm. These results suggest that a reduction in Notch-Delta signaling may account for the glial defects observed in srn mutants. |
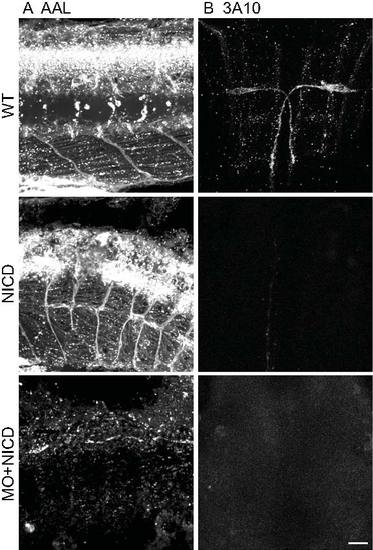
NICD overexpression suppresses the increased Mauthner neuron phenotype in gmds morphants. A. AAL staining is reduced in gmds morphants overexpressing NICD, but not in WT embryos or WT embryos overexpressing NICD. B. WT embryos have a pair of Mauthner neurons. WT overexpressing NICD showed dramatic hindbrain patterning defects, resulting in an almost complete loss of Mauthner neurons. gmds morphants overexpressing NICD showed similar reduction of Mauthner neurons. This result suggests NICD overexpression suppresses the increase of Mauthner neurons observed in gmds morphants and thus supports our conclusion that reduction of Notch-Delta signaling in srn mutants is responsible for the neurogenesis defects (3–4 embryos assessed for each manipulation). Scale bar = 20 μm. |
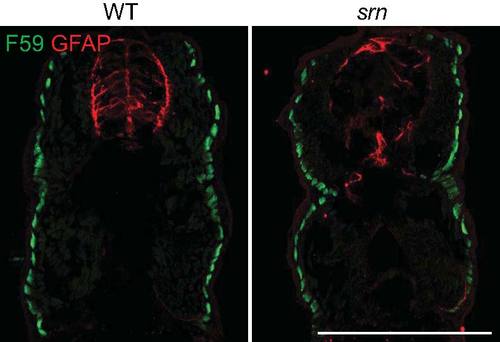
Muscle patterning is grossly normal in srn mutants. Slow muscle fibers were examined with F59 antibody and glia cells in the spinal cord were examined with GFAP antibody. While there is an obvious reduction of GFAP+ glia cells in the spinal cord in srn mutants, the patterning of slow muscle fibers is similar in srn and wild type embryos at 48 hpf. Previous work showed that fast muscle fiber number and patterning are unaltered in srn compared to wild type embryos at 48 hpf (Panzer et al., 2005; 3 embryos, 1 carrier pair were examined). Scale bar = 200 μm. |