
- Title
-
Wallerian degeneration of zebrafish trigeminal axons in the skin is required for regeneration and developmental pruning
- Authors
- Martin, S.M., O'Brien, G.S., Portera-Cailliau, C., and Sagasti, A.
- Source
- Full text @ Development
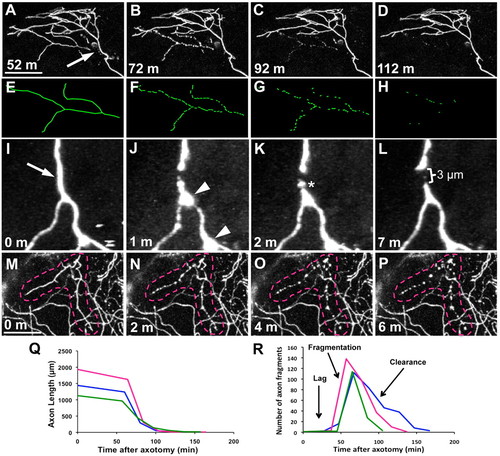
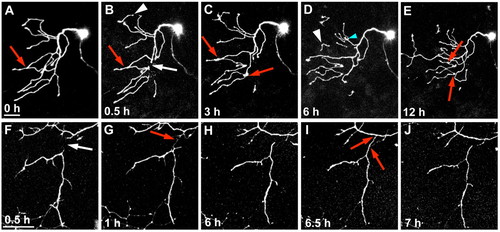
WD progresses through three phases. (A-D) Trigeminal axons were severed and time-lapse imaged at 20 minute intervals for 12 hours. Time series of confocal image stack projections, time stamps are minutes after axotomy. Arrow indicates the site of axotomy, which was performed at 54 hpf (see Movie 1 in the supplementary material). (E-H) Tracings of degenerating severed branch corresponding to A-D. (I-L) Time series of two-photon image stack projections collected every minute after axotomy to observe acute degeneration. Arrow indicates axotomy site, arrowheads indicate transient beading of severed distal fragment, asterisk marks slight fragmentation (see Movie 2 in the supplementary material). (M-P) Time series of confocal image stack projections collected every 2 minutes to capture fragmentation. Time zero in M is the last frame before fragmentation began. Broken lines outline the severed branch (see Movie 3 in the supplementary material). Scale bars: 50 μm. (Q) Quantification of total axon fragment length over time, showing three representative severed axons. (R) Quantification of number of axon fragments over time, showing three representative severed axons. Parts of the trace corresponding to the lag, fragmentation and clearance phases are indicated. |
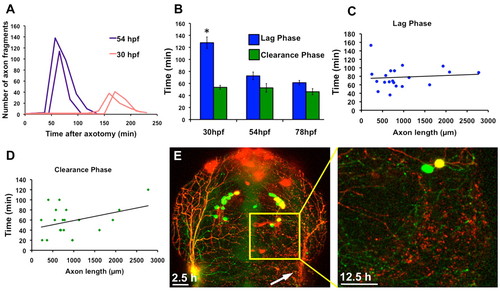
Developmental stage and axon fragment size regulate the rate of WD. (A) Quantification of the number of axon fragments versus time after axotomy in two 54 hpf (purple lines) and two 30 hpf (red lines) embryos. Fragmentation occurred at the peaks in the graph, which was much earlier in 54 hpf embryos. Thirty hpf embryos had a longer lag phase and fragmented into fewer axon fragments because axons were still growing and severed branches were therefore smaller. (B) The lag phase at 30 hpf was significantly longer than the lag phase in both 54 hpf (P=0.0001) and 78 hpf (P<0.0001) embryos, but the difference in lag phases between 54 hpf and 78 hpf was not significant (P=0.1578). The clearance phase occurred at the same rate at all ages examined (Pe0.2844). Error bars indicate s.e.m. (C) Quantification of lag phase length versus total axon fragment length. Scatter plot trendline indicates no correlation (r=0.09663) (n=20). (D) Quantification of clearance phase length versus total axon fragment length. Trendline indicates a modest correlation (r=0.3813) (n=20). (E) Confocal image stack projections of a 54 hpf embryo expressing GFP in all sensory neurons and RFP in a subset of sensory neurons. The entire trigeminal ganglion was ablated on the right side (left image, 2.5 hours after axotomy), and RFP-labeled debris remained 12.5 hours after axotomy (right image, higher magnification of boxed area in left image). |
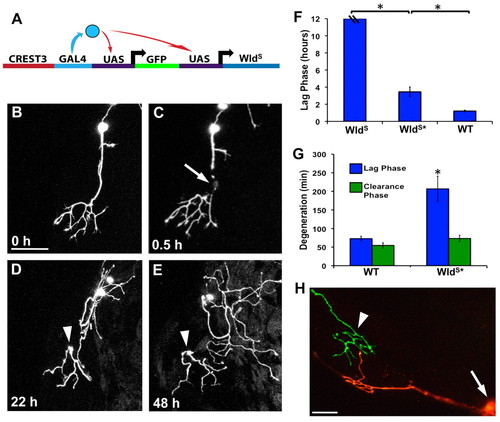
WldS potently delays degeneration and requires Nmnat enzymatic activity. (A) Schematic of the transgene used to drive expression of WldS and GFP simultaneously in sensory neurons with the CREST3 enhancer. (B-E) Confocal time-lapse series of a trigeminal neuron expressing WldS. Image in B was collected before axotomy at 30 hpf. (C) 0.5 hours post-axotomy, arrow indicates site of axotomy. (D,E) The WldS-expressing fragment 22 hours and 48 hours post-axotomy, respectively. Arrowheads indicate the persisting severed fragment (see Movie 4 in the supplementary material). Scale bar: 50 μm. (F) Quantification of the lag phase in axons expressing WldS, WldS with a mutation compromising Nmnat enzymatic activity (WldS*) and wild type at 54 hpf. Hash marks on WldS bar indicate that the lag phase lasted at least 12 hours, as all fragments persisted throughout the 12-hour time-lapse imaging sessions. The lag phase in WldS* was significantly shorter than in WldS, but still significantly longer than wild type (P<0.0001, one-way ANOVA) (ne12 for all groups). (G) Quantification of the lag and clearance phases in wild type and WldS*. Despite the lengthened lag phase in WldS* compared with wild type, the clearance phase occurs at a wild-type rate (P=0.1129). Error bars indicate s.e.m. (H) Axon expressing KikGR and WldS severed at ~30 hpf. UV illumination of the cell body (white arrow) converted KikGR protein from green to red, which spread throughout the arbor but not into the severed fragment (white arrowhead). The regenerating red parent arbor did not overlap with the green fragment. |
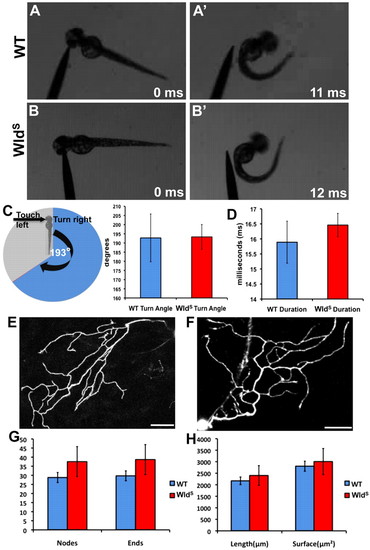
Behavioral escape responses and peripheral axon morphology of wild-type and WldS larvae are indistinguishable. (A,A′) 48 hpf wild-type larvae touched on the left side of the head (A) escape to the right (A′). (B,B′) This behavior is similar in 48 hpf WldS larvae. (C) Quantification of turn angle in wild-type and WldS larvae. Pie chart displays a cartoon fish turning 193° in the opposite direction to the touch stimulus. On the right, a bar graph shows that wild type (blue bar, n=9) and WldS (red bar, n=24) both turn an average of 193° (P=0.9676). (D) Quantification of escape response duration in wild type and WldS. Wild-type duration (blue bar, n=9) was not significantly different from WldS duration (red bar, n=24) (P=0.4624). (E,F) Confocal image stack projections of representative 54 hpf wild-type (E, n=15) and WldS (F, n=15) peripheral axons. Single neurons were traced in three dimensions (see Materials and methods). (G) Quantification of the number of nodes (branch points) and branch ends in wild-type (blue bars) and WldS (red bars) axons were not significantly different (nodes, P=0.3260; ends, P=0.3123). (H) Quantification of total length and surface area of wild-type (blue bars) and WldS (red bars) axons revealed no significant difference between the two groups (length, P=0.6182; surface area, P=0.7416). Error bars indicate s.e.m. Scale bars: 50 μm. |
Regenerating axons are repelled by persistent WldS-expressing fragments. Confocal time-lapse image stack projections of two neurons expressing WldS. (A-E) A neuron axotomized at 54 hpf. (A) Before axotomy (0 hours); (B-E) time-points post-axotomy. White arrow in B indicates site of axotomy. Red arrows indicate contact points between axons. White arrowheads in B and D indicate spontaneously pruned fragments. This series also shows an example of a rare instance when a regenerating axon crossed over a fragment (blue arrow), which also sometimes occurs in encounters between sister branches (Liu and Halloran, 2005; Sagasti et al., 2005) (see Movie 5 in the supplementary material). (F-J) A neuron axotomized at 30 hpf. White arrow in F indicates site of axotomy at 0.5 hours post-axotomy. Red arrow in G indicates filopodia from both the fragment and the intact axon extending out and contacting each other. These filopodia were repelled from each other and retracted back, as seen in H. Red arrow in I also indicates a point of contact from the fragment extending out to the intact axon, which retracts back, as seen in J (see Movie 6 in the supplementary material). Scale bars: 50 μm. |

Axon fragmentation following spontaneous pruning and cell death was delayed in WldS-expressing neurons. Time-lapse confocal image stack projections of WT (A-H) or WldS (I-P) neurons. (A-D) 40 hpf wild-type pruning beginning at –2 hours (A, before pruning). White arrow in B indicates the site of detachment of a spontaneously pruned branch (0 hours). Red arrows in C and D indicate fragmentation and clearance, respectively, of the pruned axon (see Movie 7 in the supplementary material). (E-H) 32 hpf wild-type spontaneous death example, beginning at –2 h (E, before apoptosis). White arrowheads in F and G indicate a dying cell body. Red arrow in H indicates axon fragmentation resulting from cell death (see Movie 8 in the supplementary material). (I-L) 48 hpf WldS pruning beginning with –1 hour (I, before pruning). White arrow in J indicates site of detachment of spontaneously pruned branch (0 h). Red arrowheads in K and L indicate a pruned branch that persists without degenerating (see Movie 9 in the supplementary material). (M-P) 36 hpf WldS cell death example beginning at –2.5 hours (M, during apoptosis). White arrowheads in M and N indicate a dying cell body. White arrow in N indicates a point of axon separation (0 hours). Red arrow in O indicates degeneration of the proximal axon nearest to the dead cell body. Red arrowhead in P indicates a large distal axon fragment that has remained intact long after cell death and proximal axon degeneration (see Movie 10 in the supplementary material). Scale bars: 50 μm. |
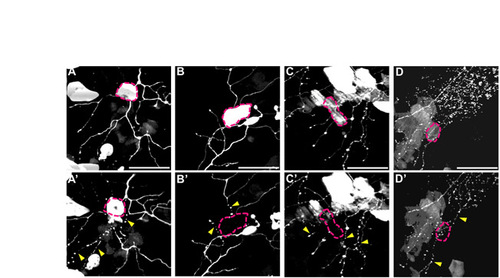
Keratinocyte damage causes immediate axon fragmentation following axotomy. Two-photon image stack projections of four different trigeminal axons (A-D) and neighboring keratinocytes expressing GFP. (A-D) Skin cells (marked by pink dotted lines) that overlap with axons before axotomy and ablation. Two-photon laser ablation of skin cells was performed concurrently with axotomy of the adjacent axon. (A′-D′) Immediately after ablation/axotomy. Pink dotted lines indicate damaged/dead keratinocytes, and yellow arrowheads indicate axons that instantly fragmented (n=5). Scale bars: 50 μm. |

Regenerating axons expressing WldS and KikGR avoid persistent axon fragments. Axons expressing WldS and the photoconvertible protein KikGR were severed. At least 6 hours later, the cell bodies (white arrows) were photoconverted so that only the detached, persisting fragments remained green (white arrowheads). (A-D) After photoconversion red fluorescent arbors never grew into areas occupied by green fluorescent fragments. Scale bars: 50 μm. |
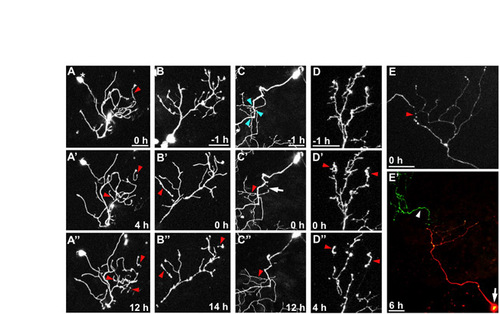
Axon degeneration after spontaneous pruning was delayed in WldS-expressing neurons. (A) WldS-expressing neuron during instigation of pruning (0 hours, red arrowhead indiactes pruned axon piece). Asterisk indicates a deeper neuron in the forebrain also expressing GFP. (A′) Four hours after initial pruning event, another axon fragment spontaneously detached (red arrowhead). (A′′) Twelve hours after first pruning event, another fragment detached and all three persisted (red arrowheads). (B) One hour before pruning. (B′) During instigation of pruning, red arrowhead indicates detached axon. (B′′) Fourteen hours later, pruned fragment was still intact and another small axon piece had detached (red arrowheads). (C) An arbor with sister branch overlap (blue arrowheads), which occurs occasionally even in wild-type neurons (Sagasti et al., 2005), 1 hour before pruning. (C′) During pruning, red arrowhead points to detached branch, white arrow indicates point of detachment. (C′′) Twelve hours later, pruned branch persisted. (D) One hour before pruning. (D′) During pruning, two axon fragments detached. (D′′) Four hours later, the fragments were still intact. Scale bars: 50 &MU;m. (E) An axon expressing KikGR and WldS underwent spontaneous pruning (0 hours, red arrowhead) and its cell body (white arrow) was UV illuminated after time-lapse to convert KikGR protein from green to red (E′, 6 hours after pruning). Note that the detached fragment continued to fluoresce green (white arrowhead) and that the parent arbor did not regenerate over the fragment. |