- Title
-
Cellular response after crush injury in adult zebrafish spinal cord
- Authors
- Hui, S.P., Dutta, A., and Ghosh, S.
- Source
- Full text @ Dev. Dyn.
|
Longitudinal sections of normal uninjured (A, J) and injured (B–H and K–L) zebrafish spinal cord after H&E (A–H) and luxol fast blue/cresyl violet staining (J–L). A, J: Uninjured spinal cord section shows the presence of white matter (WM), grey matter (GM), neurons (n) in the subependyma (sep), and ependyma (ep) with ependymal canal (epc). J.1: The higher magnification of J shows an axon (→) in white matter and neurons (n) in the subependyma (sep). B: 1dpi-section of spinal cord showing loss of both white and grey matter, infiltration of blood cells (red *), and disrupted ependyma (▼▼) at the injury epicenter ([bracket]). C, K: 3dpi cord shows blood clot at the site of injury (**) and same section at higher magnification (C.1) showing initiation of sealing of ependymal canal (ep2) and migrating ependymal cell (white arrow). Another section of 3dpi cord (K) showing severed ependyma, axonal loss (spiral arrow) and neuronal loss at the injury epicenter (double arrowheads). K.1: Higher magnification of K. D: 5dpi cord reveals accumulation of cells at epicenter and tissue edema. Another 5`dpi cord at higher magnification (D.1) shows complete sealing of ependyma (ep′) and formation of ependymal bulb (epb). E: Section of 7dpi cord reveals accumulation of cells at the injury epicenter, swelling of tissue, and also the presence of a continuous cavity like structure (ca) surrounded by ependymal cells. F: 10dpi cord showing the presence of a smaller cavity (ca) -like structure continuous with regenerating ependymal canal. F.1: Same cord at higher magnification, showing the presence of many newly formed cells (►) and a mature neuron (n) in the injury epicenter. G: Representative section of 15dpi cord reveals a normal regenerated ependyma with complete absence of a cavity-like structure and partially regenerated white matter. G.1: Higher magnification of the same section shows well-formed ependyma (ep) with an ependymal canal (epc) and regenerated neuron (n) in subependyma (sep). H, L: One-month regenerated cord shows both grey and white matter regeneration and both neurons (n) and axons (→) are clearly visible at the injury epicenter at higher magnification (H.1, I). Another section (L) showing regeneration of both white matter and grey matter at the injury epicenter and the same cord at higher magnification (L.1) showing small neuronal cell bodies (n), reconnected axons (↓), and compact ependyma (ep). M, N: Oligodendrocyte (OL) and myelinated axon (ax), with sparsely distributed neurofilaments (nf) within the axonal body in uninjured cord, respectively. O-P: Representative picture of demyelinating axons (dax) at the injury epicenter of 3dpi cord showing denuded axon (bold arrow) and axonal body with dense neurofilaments (nf). Q,R: 10dpi cord showing dividing Schwann cells (dsc) and Schwann cells (SC) associated with demyelinated axons (dax) at the injury epicenter, respectively. S: Remyelinating axon (rax) with Schwann cells (SC) in regenerating cord 1 month post-injury. T: Higher magnification of indicated area in S showing the basal membrane of Schwann cells (white arrowhead) around the remyelinating axon (rax). Scale bar = 400 μm (A-H), 20 μm (C.1), 40 μm (D.1-I), 200 μm (J-L), 60 μm (J.1–L.1), 2 μm (M–T). |
|
Trichrome staining (A-C) and ultrastructural analysis (D-I) of injured zebrafish spinal cord. A: 1dpi cord shows infiltration of large number of RBC (↓) both at the injury epicenter (double arrowheads) and also towards the normal part of the cord. B: A 3dpi cord showing less number of infiltrating R.B.C. C: A 5dpi cord shows presence of very few blood cells and the appearance of ependymal bulb (epb) at the injury epicenter. A.1, B.1, C.1: Higher magnification representation of A, B, and C, respectively, showing the presence of blood cells at the injury epicenter. D-G: Presence of macrophages (ma) at the injury epicenter in 3dpi (D-F) and 10dpi (G) cord. D, E: Macrophage (ma) with a typical phagocytic process (↑) and in close proximity to a demyelinating axon (dax), respectively. F: A dying neuron (n) with condensed nuclear matter surrounded by infiltrated macrophages (ma) and a blood vessel (bv) nearby. G: Macrophage (ma) with many lipophillic vacuoles (►) and phagocytosed myelin debris (thick arrow). H, I: The presence of neutrophils (neu) and monocytes (mon), respectively, in 3dpi cord. Scale bar = 250 μm (A-C), 50 μm (A.1-C.1), 5 μm (D, F), 2 μm (H, I), 1 μm (E, G). |
|
Time course analysis of injury-induced cell proliferation represented after BrdU incorporation and H3P staining in uninjured and injured spinal cord. A, B: Uninjured cord shows BrdU+ cells are present both in grey matter (▼) and white matter (→) but mostly in ependyma (ep). C: 3dpi cord shows a large increase in BrdU+ cells in both grey (▼) and white (→) matter. D: A section of 7dpi cord shows a very significant increase in number of BrdU+ cells in both grey (▼) and white matter (→), and increased numbers of cells are present at the injury epicenter ([down bracket]) compared to 3dpi cord. E: A 10dpi cord shows incorporation in both white matter (→) and grey matter (π) but a considerable decrease in number of BrdU+ cells compared to 7dpi cord. F: A 15dpi cord section shows fewer BrdU+ cells in grey (▼) and white matter (→) compared to the 10dpi cord and the number is still higher than in the uninjured cord. G: Quantitative representation of BrdU+ cells in both grey and white matter of uninjured and injured cord at different time points. H: A 7dpi cord section shows BrdU+ cells (▼) and many of these are colocalized with H3P (↓) in both the injury epicenter ([down-bracket]) and adjacent part. H.1, H.2: Same 7dpi cord as in H showing adjacent area and injury epicenter, respectively, at high magnification. I, J: Another representative cross-section of 7dpi cord showing distribution of H3P+ cells (squiggly arrow) around the central canal (c) and DIC of same section. K: Ependyma of uninjured cord showing both slow-dividing (thick arrow) and fast-dividing (∨) cells. L: Section of 7dpi cord showing BrdU+ slow-dividing cells (thick arrow) after 48-hr continuous BrdU pulse. Scale bar = 400 μm (A-H), 20 μm (H.1-K), 200 μm (L). |
|
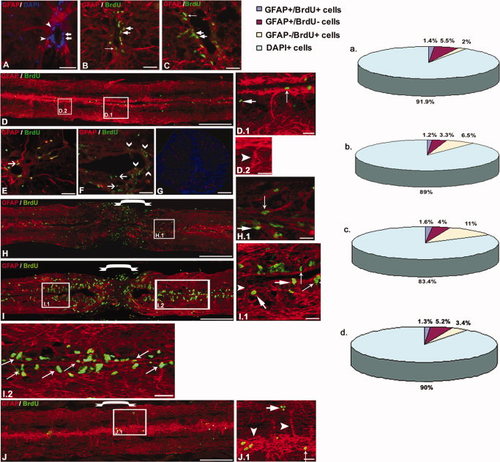
Immunohistochemical staining of GFAP and BrdU in zebrafish uninjured (A,B, D,E, D.1, and D.2) and injured (C, F, H-J, H.1, I.1, and J.1) spinal cord. A, B: Uninjured cord section showing that a percentage of DAPI+ cells are GFAP+ radial glia (arrowhead) and the presence of BrdU+ cells (thick arrow) around the central canal; some colocalize with GFAP (→). C: 7dpi cord section shows an greater number of BrdU+ cells around the central canal than normal; a few colocalized with GFAP (→). D: Uninjured cord showing high GFAP expression and the presence of few BrdU+ cells. Same cord at a higher magnification showing different radial glial population, GFAP+/BrdU+ (↑) and GFAP-/BrdU+ (thick arrow) cells (D.1) and GFAP+/BrdU- cells (▼) (D.2), respectively. E: Ependyma of uninjured cord showing many more slow-dividing cells (→), some of which are radial glia and a few fast-dividing cell. F: 7dpi cord representing many BrdU+, fast-dividing cells that are GFAP- (∨) and fewer slow-dividing cells (→) around ependyma. G: Control section stained without GFAP primary antibody. H: 3dpi cord, showing proliferating BrdU+ cells; only some are GFAP+. Also shown is a loss of GFAP expression at the injury epicenter ([down-bracket]) and at an immediately adjacent part of the cord. H.1: Same cord as in H at higher magnification showing both GFAP+/BrdU+ (↑) and GFAP-/BrdU+ (thick arrow) cells. I: 7dpi cord showing high proliferation, a low level of GFAP expression at the injury epicenter, and little higher level of GFAP expression at the immediate adjacent area. I.1: Same cord at higher magnification shows presence of GFAP+/BrdU+ (↑), GFAP-/BrdU+ (thick arrow) and GFAP+/ BrdU- (▼) cell populations. I.2: Same cord shows the presence of many GFAP+/BrdU+ (↑) cells. J: Fifteen-day regenerated cord shows a reduced BrdU incorporation but a high level of GFAP expression in both the uninjured part and the injury epicenter. J.1: Same section at higher magnification also represents three populations. a-d: The pie chart represents the percentage of three cell populations and DAPI+ cells in adult uninjured (a), 3dpi (b), 7dpi (c), and 15dpi (d) cord, respectively. Scale bar = 250 μm (D and H–J), 20 μm (A-C, E-G, D.1-J.1). |
|
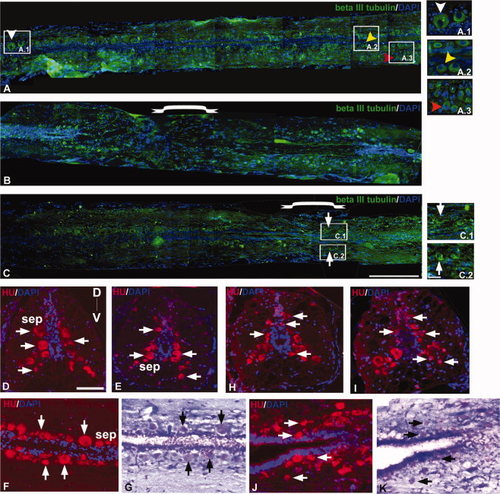
Immunohistochemical staining of β-III tubulin (A-C), Hu (D–F and H-J), and counter-staining of Luxol fast blue/Cresyl violet (G and K) in zebrafish uninjured (A, D–G) and injured spinal cord (B,C, and H–K). A: Section of uninjured cord shows the spatial distribution of different types of neurons sensory neurons (white ▼), interneurons close to ependyma (yellow ▼), and motorneurons (red ▼). A.1, A.2, A.3: Higher magnification of indicated areas of A showing different types of neurons. B: 3dpi cord section showing the loss of mature neurons at the injury epicenter. C: One month post-injured cord section showing regenerated neurons at the injury epicenter. C.1, C.2: Higher magnification of indicated areas in C, where formation of new neurons (thick arrow) both at the dorsal and ventral sides can be seen. D–F: Sections of uninjured cord showing the distribution of Hu+ neurons (thick arrow) in the subependyma (sep) along the D-V axis. G: Luxol fast blue/Cresyl violet staining of F. H–J: Sections from 10dpi cord showing the presence of Hu+ newly formed neurons (thick arrow) in different locations along the D-V axis. K: Staining of the same section in J with Luxol fast blue/Cresyl violet. Scale bar = 250 μm (A-C), 50 μm (A.1-A.3, C.1,C.2, D-K). |
|
Immunohistochemical localization of Hu, NeuroD, and BrdU (A-D) and ultrastructural analysis (E-H) in zebrafish spinal cord. A: Uninjured spinal cord shows the presence of many Hu+ cells (thick arrow) in subependyma, which are NeuroD-. B: The 10dpi cord section shows Hu+ cells (thick arrow) at the injured site (▼▼) and a few of these are NeuroD+ (▲). B.1, B.2: Higher magnification of indicated areas in B showing both populations of cells in the injury epicenter and the immediate adjacent part, respectively. Note that newly generated neurons extend projections (side arrow). C: Uninjured cord showing many subependymal Hu+ cells (thick arrow) and very few of them are BrdU+ (∨). C.1: At higher magnification, the same section as in C showing both Hu+/BrdU- cells (thick arrow) and Hu+/BrdU+ cell (∨). D: The 7dpi cord section shows only BrdU+ cells (→) both at the injury epicenter and in the immediate adjacent part of the epicenter. In both these regions, the number of Hu+/BrdU+ cells (∨) are higher than the normal uninjured cord and are also present close to the pial membrane at the injured site (▼▼). D.1-D.4: Same as D at higher magnification showing the presence of Hu+/BrdU+ (∨), Hu+/BrdU- thick arrow), and Hu-/BrdU+ (thin arrow) cells in the injury epicenter (D.1), adjacent normal part (D.2), subpial location (D.3), and the immediate adjacent part of epicenter (D.4) respectively. D.5: Represent the presence of both slow (bold arrow) and fast (squiggly arrow) population (D.5b) of Hu+ cells in both ependyma (ep) and subependyma (sep) (D.5a) and their respective merge (D.5c) and DIC (D.5d). E: 10dpi cord showing dividing neuronal progenitor cells (pc) at the injury site. F: One-month post-injured cord shows the presence of both newly formed neuron (n) and specified motor neuron (mn). G: Higher magnification picture of newly formed neuron (n) with a small cytoplasmic area (cy) and a few cytoplasmic organelles (white arrowhead). H: Higher magnification picture of specified motor neuron with a large volume of cytoplasm and many cytoplasmic organelles (white arrowhead). Scale bar = 200 μm (A-D), 20 μm (B.1-D.3), 10 μm (D.4), 2 μm (E-H). |
|
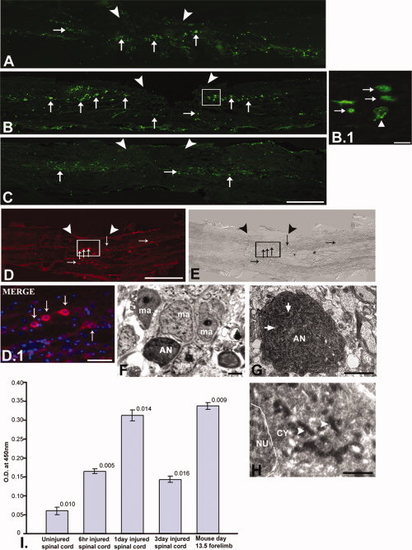
TUNEL staining (A-C), caspase-3 immunohistochemistry (D-E), ultrastructural analysis (F-H), and quantification of caspase-3 (I) in injured zebrafish spinal cord. A: The 6-hr post-injured spinal cord section shows the presence of apoptotic TUNEL-positive cells (thin arrow) both at the injury epicenter (▼▼) and immediate adjacent part. B: The 1dpi cord shows many TUNEL-positive cells (thin arrow) close to the injury epicenter. B.1: The higher magnification picture of B shows many apoptotic cells (thin arrow) and a cell with fragmented nuclear matter (up white arrowhead). C: The 3dpi cord section shows less TUNEL-positive cells (thin arrow) compared to 1dpi cord. D, E: 1dpi cord section shows the presence of many caspase-3-positive apoptotic cells (thin arrow) at the injury epicenter with respective DIC. D.1: Higher magnification of same section shows some caspase-3-positive cells (thin arrow). F-H: Representative pictures of different apoptotic neurons in 3dpi cord, showing apoptotic neuron (AN) surrounded by macrophages (ma, F), another showing a fragmented nucleus (thick arrow) and retracted cytoplasm (G), and a third showing dying mitochondria (right white arrowhead) within the cytoplasm (H). I: Quantification of caspase-3 protein in uninjured and injured zebrafish spinal cord. Mouse day-13.5 forelimb represented positive control. Scale bar = 200 μm (A-E), 50 μm (D.1), 10 μm (B.1), 2 μm (F,G), 1 μm (H). |
|
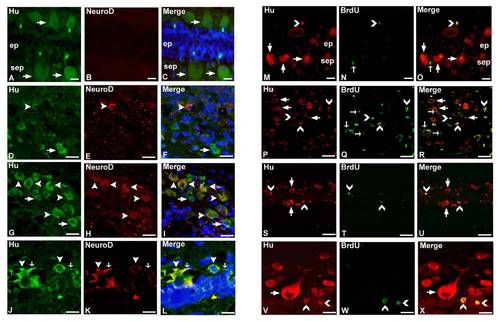
Quantitative analysis of GFAP/BrdU/DAPI expressing cells in whole spinal cord (equivalent to 4 mm length) before and after giving injury. Supp. Fig. S2. Immunohistochemical colocalization of Hu/NeuroD (A-L) and Hu/BrdU (M-X) in zebrafish spinal cord. A-C: Adult uninjured spinal cord section shows many Hu+ cells (→) in subependyma (sep) but are NeuroD-. D-F: The injury epicenter of a 10dpi cord shows Hu+ cells (→) and some of them are colocalized with NeuroD (▼). G–I: Colocalization of Hu and NeuroD (▼) can be seen in the immediate adjacent part of the injury epicenter in the same day cord. J-L: The immediate adjacent part of the injury epicenter of 10dpi cord also shows Hu+/NeuroD+ cells (▼) with small projections (↓). M-O: Uninjured cord section shows many Hu+ cells (→) in subependyma (sep); very few of them are BrdU+ (). P–U: Injury epicenter (P–R) and adjacent normal part (S–U) of the 7dpi cord, both showing Hu+/BrdU- (→), Hu/BrdU+ () and Hu+/BrdU+ () cells. Note that Hu+/BrdU+ cells are small and round shaped and are newly formed neurons. V-X: Higher magnification picture of the immediate adjacent part of the injury epicenter in 7dpi cord showing similar morphological characteristics of Hu+/BrdU+ cells. Scale bar = 10 μm (A-C, M-O), 20 μm (D-I), 40 μm (P-U), 5 μm (J-L, V-X). |


