
- Title
-
Segment Number and Axial Identity in a Segmentation Clock Period Mutant
- Authors
- Schröter, C., and Oates, A.C.
- Source
- Full text @ Curr. Biol.
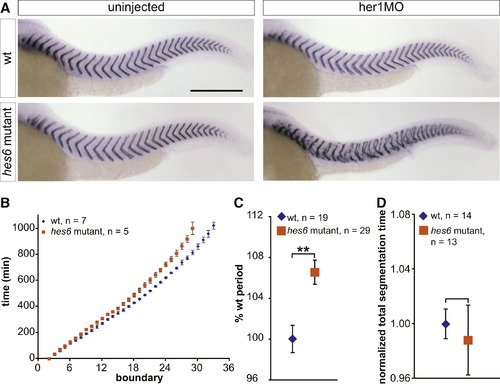
Mutating hes6 Slows Somitogenesis Period (A) Uninjected and her1MO-injected wild-type and hes6 mutant embryos were stained with a cb1045 riboprobe to analyze segmentation. Wild-type (upper left), hes6 mutant (lower left), and her1MO-injected wild-type embryos (upper right) segment grossly normally, but injecting her1MO into hes6 mutants disrupts segmentation (lower right). For segmentation phenotypes of hes6 morphants, see also Figure S1 and Table S1. The scale bar represents 0.3 mm. (B) To determine somitogenesis period along the entire axis, embryos were anesthetized with 0.02% tricaine and filmed in a multiple-embryo time-lapse array. Formation times of somite boundaries were read from the movies and normalized to the formation time of the second somite boundary for each individual. Data points show mean formation times ± standard deviation for each somite and genotype. Somitogenesis period is increased in hes6 mutant embryos along the entire axis, and hes6 mutants stop somitogenesis with a smaller number of segments. One representative experiment out of three independent trials is shown. (C) Trunk somitogenesis period was estimated from a linear fit to the data points corresponding to somites two through 18 in the somite number versus time plot. Data were pooled from three independent experiments by normalizing wild-type period to 100%. hes6 mutants segment ∼6.5% slower than their wild-type siblings. (D) Total segmentation time was calculated from time-lapse movies as the time span between formation of the second and the last visible somite boundary. Data are pooled from three independent experiments by normalizing the mean segmentation time of wild-type embryos to 1. Wild-type and hes6 mutant embryos segment for the same total amount of time. Data in (C) and (D) are displayed as mean ± 95% CI. **p d 0.001, Student′s t test. |

Unchanged Axial Elongation and Longer Somites in hes6 Mutant Embryos (A) Total axial length was measured from stills of time-lapse movies by drawing a line (red plus white) from the anterior to the posterior end of the embryo, following the yolk and the dorsal aspect of the paraxial mesoderm. PSM length was measured along the same line (red part) as the distance between the most recently formed somite boundary (arrowhead) and the posterior end of the mesoderm (arrowhead). Three representative stages are shown. The scale bar represents 0.3 mm. (B) Axial length as measured in (A) is indistinguishable between wild-type and hes6 mutants throughout trunk somitogenesis. Arrowheads on the x axis indicate when wild-type embryos reached the five-, ten-, and 15-somite stage. (C) PSM length measured as in (A) (red line) is indistinguishable between wild-type and hes6 mutants at three stages during trunk somitogenesis. Measurements were taken at simultaneous time points in all samples; the x axis label indicates average number of somites in wild-type embryos at the respective time point. (D) PSM length and wavefront position measurement from a fixed PSM stained with myoD (red) to label formed somites and mespb (dark blue) to indicate the wavefront position. Embryo is at the ten-somite stage, flat mount, anterior to the top. The scale bar represents 50 μm. (E) PSM length and distance of the wavefront from the most recently formed somite boundary as indicated in (D) are indistinguishable between wild-type and hes6 mutant embryos. Genotypes were determined by the presence or absence of hes6 in situ signal (blue staining in the tailbud in D). One representative experiment from three independent trials is shown in (B) and (C) and from two independent trials in (E). In no case was a difference between wild-type and mutant embryos observed. (F) Anteroposterior length of somites two to four was measured by drawing a straight line (red) connecting the contact points of the rostral and caudal somite boundaries with the notochord. The scale bar represents 50 μm. (G) Mean anteroposterior length of somites two to four. Data are pooled from four independent experiments by normalizing mean length of wild-type somites to 1. Somites in hes6 mutants are approximately 6%–7% longer than in their wild-type siblings. Data in (B), (C), (E), and (G) are given as mean ± 95% CI; **p ≤ 0.001, Student′s t test. PHENOTYPE:
|
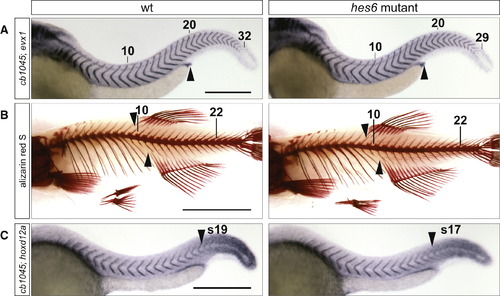
hes6 Mutants Have a Reduced Number of Embryonic and Adult Segments, and the Change in Segment Number Is Distributed across Axial Regions (A) Embryos at 48 hpf were stained with the myotome boundary marker cb1045 and evx1, which labels the proctodeum (arrowhead). hes6 mutants have fewer myotomes than their wild-type siblings, and their proctodeum aligns with the 16th segment instead of the 17th or 18th as in the wild-type. The tenth, 20th, and last segment are indicated. The scale bar represents 0.3 mm. (B) Skeletal stains of 2-month-old wild-type and hes6 mutant fish. The mutant has fewer vertebrae and ribs but an otherwise normal morphology of the vertebral column. The anterior insertion sites of the anal and dorsal fin (arrowheads) align with a higher vertebral number in wild-type compared to hes6 mutant fish. The 10th and 22nd vertebrae are indicated. The scale bar represents 0.5 cm. (C) Embryos at 25 hpf were costained for cb1045 and hoxd12a expression. The anterior border of hoxd12a expression (arrowhead) coincides with a lower segmental count in hes6 mutant compared to wild-type embryos. The scale bar represents 0.3 mm. See also Figure S2, Table S2, and Table S3. PHENOTYPE:
|

The hes6 retroviral insertion results in a strongly hypomorphic allele A Schematic of the genomic organization of the hes6 mutant locus. The proviral insertion is located towards the 3′ end of the first exon of the gene. Positions of primers used for genotyping and cDNA analysis are indicated by arrows. B Sequence of the retrovirally inserted hes6 locus. Black: 5′UTR, green: exon one coding sequence, red: retroviral sequence, blue: predicted translation. The retroviral insertion creates several stop codons (bold) in frame with the wildtype hes6 translation. This gives rise to a predicted protein that terminates before the bHLH domain, which mediates DNA-binding and dimerization. The genomic organization of the locus was determined by sequencing, but we cannot rule out that alternative splicing or read-through might yield some translation of longer polypeptides than the 19 amino acid fragment shown. C Embryos from an incross of heterozygous carriers were in-situ stained with a hes6 riboprobe. Strong (C) and weak staining patterns (C′) are observed in a mendelian ratio (60/82 and 22/82, respectively), indicating that the retroviral insertion results in a strong reduction of hes6 expression. D PCR on poly-dT primed cDNA indicates absence of mature hes6 mRNA in the mutant (lanes 1 and 2), but points towards the presence of a poly-A-tailed transcript containing the provirus (lanes 3 and 4), explaining the weak staining seen in C′. E Previous studies performing hes6 knockdown reported segmentation defects upon loss of hes6 function [1]. To test whether we could reproduce these results, wildtype and hes6 mutant embryos were injected with MO3-hes6 [2] or left uninjected and grown to an equivalent of 34 hpf at 33°C or 20°C. In-situ staining with the myotome boundary marker cb1045 reveals posterior segmentation defects (red arrowheads) in mutant and injected embryos. Note that segmentation phenotypes were of different penetrance and severity (see also Table S1 below). Injections with MO1-hes6 [1] gave similar results (not shown, see also Table S1 below). Scale bar 300 μm. EXPRESSION / LABELING:
PHENOTYPE:
|

The segmental position of the pectoral fin bud is unchanged between wildtype and hes6 mutant embryos 48 hpf embryos were in-situ stained with the myotome boundary marker cb1045 and tbx5, which marks the pectoral fin bud (arrowhead). This structure aligns with the second segment in both wildtype and hes6 mutant embryos. EXPRESSION / LABELING:
|