
- Title
-
Intercellular Coupling Regulates the Period of the Segmentation Clock
- Authors
- Herrgen, L., Ares, S., Morelli, L.G., Schröter, C., Jülicher, F., and Oates, A.C.
- Source
- Full text @ Curr. Biol.

Somitogenesis Period Increases after Reduction in Delta-Notch Coupling (A) Delta-Notch coupling between two oscillating PSM cells. Delta is the ligand for the Notch receptor, which can be inhibited via the small molecule DAPT. Mib is a ubiquitin ligase required for Delta trafficking and activation. (B) Time-lapse movies of wild-type (wt) and mib embryos. Bars indicate formed somite boundaries; arrowheads indicate forming boundaries. Dorsal view is anterior to top. The scale bar represents 50 μm. (C) Time versus somite number plot for (B). Linear fits of data (R2 [wt and mib] = 0.999) yield somitogenesis periods of 20.5 min (wt) and 25.0 min (mib). (D) Distribution of somitogenesis periods in the experiment from which (B) and (C) were taken (n [wt] = 12, n [mib] = 11). Blue bars indicate mean somitogenesis period. Temperature = 28.2 ± 0.1°C. (E) Box-and-whisker plots of somitogenesis period: n ≥ 37 total embryos, more than six independent trials per experimental condition, except ace/fgf8, mbl/axin1, and nof/raldh2, for which n ≥ 16 total embryos, two independent trials per experimental condition. het denotes heterozygote. **p < 0.001, Student′s t test. Figures S1 and S2 show that general developmental rate is unaffected in the conditions with slower period. The central box covers the interquartile range with the mean indicated by the small square and the median by the line within the box. The whiskers extend to the 5th and 95th percentiles, and small bars depict the most extreme values. PHENOTYPE:
|
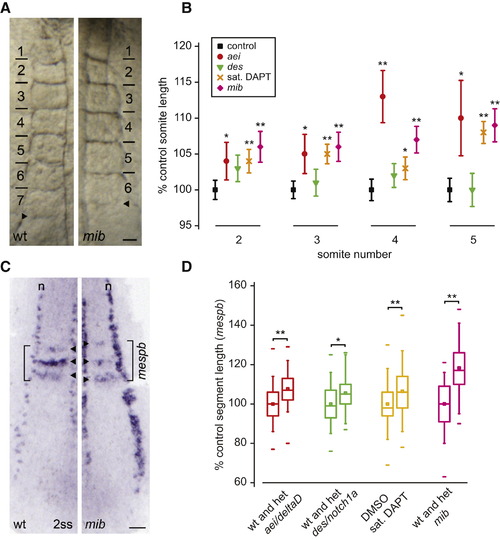
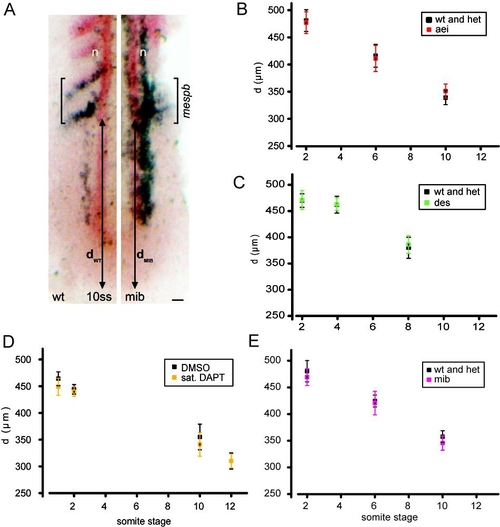
Segment Length Increases after Reduction in Delta-Notch Coupling (A) Somites of six-somite-stage live embryos. Bars indicate formed somite boundaries; arrowheads indicate forming boundaries. Dorsal view is anterior to top. The scale bar represents 25 μm. (B) Somite lengths (mean ± 95% CI), n ≥ 40 total embryos per experimental condition, except n = 14 for somite five in aei/deltaD, six independent trials per experimental condition. For control population, the largest CI detected is displayed. (C) In situ hybridization of mespb (arrowheads) and isl1 (interneurons, Rohon-Beard neurons, n). The scale bar represents 50 μm. (D) Box-and-whisker plots of segment length, n ≥ 40 total embryos, more than three independent trials per experimental condition. *p < 0.01, **p < 0.001, Student′s t test. Figure S3 shows that the position of the arrest front in the PSM is unchanged in the conditions with increased segment length. The central box covers the interquartile range with the mean indicated by the small square and the median by the line within the box. The whiskers extend to the 5th and 95th percentiles, and small bars depict the most extreme values. EXPRESSION / LABELING:
PHENOTYPE:
|
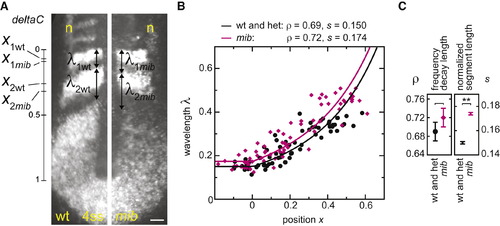
Determination of Segmentation Clock Collective Period from Oscillating Gene Expression Patterns (A) In situ hybridization: deltaC and isl1 (interneurons and Rohon-Beard neurons, n) in representative wild-type and mib embryos. The scale bar represents 50 μm. (B) Measurements of normalized gene expression wavelength λ and position x; wild-type is black and mib is pink. Data points: n (wt) = 65, 28 embryos, n (mib) = 70, 28 embryos, two independent trials. Curves indicate fit of Equation 3 to data (Experimental Procedures). (C) Values of frequency profile decay length ρ, and normalized segment length s parameters from the fit to the data. Error bars show 95% CI from bootstrap analysis (Supplemental Experimental Procedures 2.2.5). **p < 0.001, Student′s t test. EXPRESSION / LABELING:
PHENOTYPE:
|

ZFIN is incorporating published figure images and captions as part of an ongoing project. Figures from some publications have not yet been curated, or are not available for display because of copyright restrictions. PHENOTYPE:
|
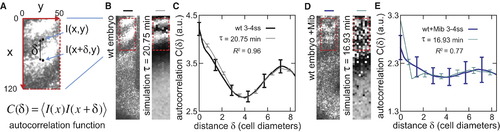
Coupling Time Delays Regulate the Stability of the Segmentation Clock (A) Schematic of how the autocorrelation function (Equation 6, Experimental Procedures) is computed. A magnification of the gene expression pattern from (B) is shown, together with the reference axes x and y in pixels, and the distance δ between two sample points of gene expression intensity I. (B) Representative cyclic dlc expression in PSM of wild-type embryo and DCT simulation with wild-type parameters defined in this work, black dot in Figure 5C. (C) Average autocorrelation function of spatial patterns in red box from (B): n (embryos) = 15, black line; n (simulations) = 20, gray line. Error bars show standard error of the mean (SEM). (D) Representative experimental Mib overexpression (400 pg mRNA) and corresponding DCT simulation with reduced coupling delay, blue dot in Figure 5C. (E) Average autocorrelation function of spatial patterns in red box from (D): n (embryos) = 8, dark blue line; n (simulation) = 20, light blue line. The arbitrary units in the correlation axis are multiplied by 10-3. Figures S5 and S6 show the autocorrelations for decreasing delays in numerical simulations and increasing levels of Mib overexpression in the Figure S7 shows that the Delta-Notch loss-of-coupling mutants have autocorrelation functions distinct from Mib overexpression. Error bars show SEM. EXPRESSION / LABELING:
|
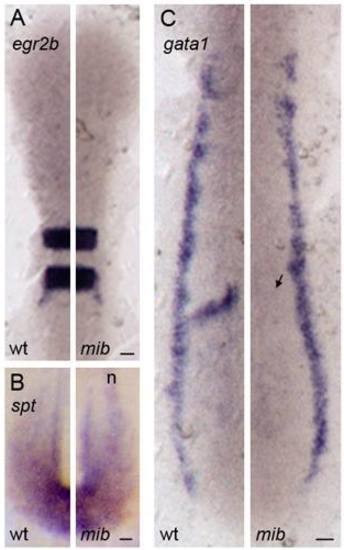
Expression of mesoderm and ectoderm differentiation markers in mib embryos |

Axial elongation is not changed in Delta-Notch mutant and DAPT-treated embryos PHENOTYPE:
|
Position of arrest front is unchanged within the PSM of Delta-Notch mutants and DAPT-treated embryos |
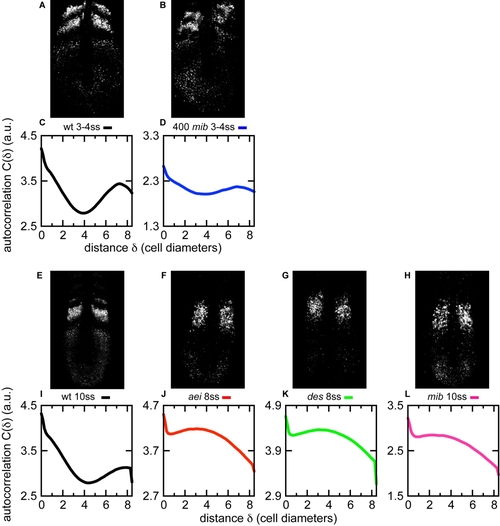
Cyclic gene expression patterns resulting from elevated Mib levels are distinct from loss of coupling mutants |