
- Title
-
B1 SOX coordinate cell specification with patterning and morphogenesis in the early zebrafish embryo
- Authors
- Okuda, Y., Ogura, E., Kondoh, H., and Kamachi, Y.
- Source
- Full text @ PLoS Genet.
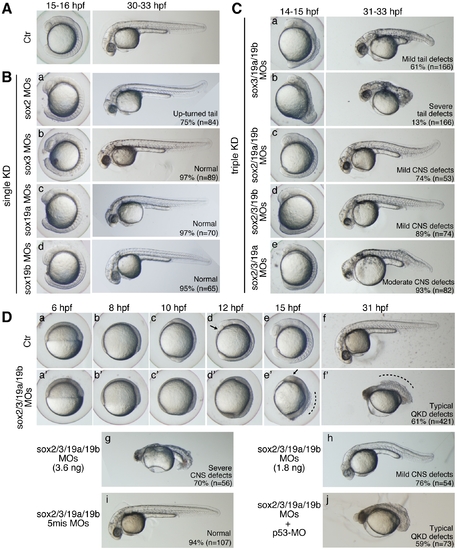
Single, triple, and quadruple knockdowns of sox2/3/19a/19b. Bright-field images of live embryos observed at the indicated time points. All are lateral views. (A) Uninjected control (Ctr) embryos. (B) Single knockdowns of sox2/3/19a/19b. A 1:1 mixture of two MOs (0.9 ng each) targeting one of the four B1 sox genes was injected for a single KD. The percentage of embryos in the same morphological class is indicated in each panel. (C) Triple knockdowns of sox2/3/19a/19b. A mixture of indicated combinations of MOs (i.e., a mixture of six MOs, 5.4 ng in total) was used to simultaneously knockdown three out of the four B1 sox genes. The major classes of morphological defects are shown with the percentage of occurrence. The remaining embryos showed either milder or more severe defects. (D) Uninjected control embryos (a–f) and sox2/3/19a/19b quadruple knockdown (QKD) embryos injected with a mixture of MOs targeting the four B1 sox genes (i.e., a mixture of eight MOs, 7.2 ng in total) (a′–f′). The QKD caused very severe developmental abnormalities: a delay in epiboly, a shortened anterior-posterior axis, and impairment of CNS development (61%). The remaining embryos showed either milder defects (7%), more severe defects (24%) or lethality (8%). The aberrant movement of the anterior prechordal plate (arrows in d and e′) suggests a decreased adhesion of ectodermal cells as well as defects in convergence and extension movements in the QKD embryos. The broken lines (e′ and f′) indicate the dorsal trunk regions where cell dissociation was observed. (g, h) Dose-dependent effects of the MOs used for QKD were examined by injecting reduced amounts of the mixture of MOs targeting the four B1 sox genes (3.6 ng in total [g] and 1.8 ng in total [h]). (i) As a negative control, a mixture of 5-base-mismatch control MOs (i.e., a mixture of eight 5mis-MOs, 7.2 ng in total) was injected. (j) The coinjection of a p53-MO (2 ng) had no impact on the neural defects in the QKD embryos. PHENOTYPE:
|
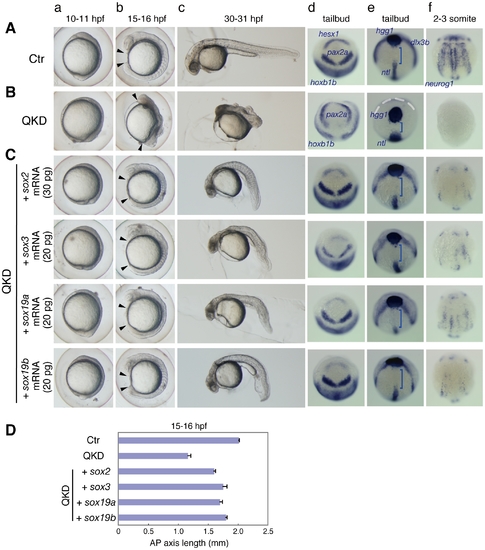
Rescue of the QKD phenotype by exogenous B1 sox mRNAs. (A, B) Uninjected control (Ctr) embryos (A) and the QKD embryos (B). Live embryos were observed at 10–11 (a), 15–16 (b) and 30–31 (c) hpf. Expression of hesx1, pax2a and hoxb1b (d), dlx3b, hgg1 and ntl (e), and neurog1 (f) was visualized by whole-mount in situ hybridization. Lateral views (a–c); dorsal views with anterior to the top (d–f). (C) The QKD phenotype is similarly rescued by an exogenous supply of any B1 sox mRNA. The MOs for QKD were coinjected with the indicated mRNAs. In the B1 sox mRNA-coinjected embryos, the expression of hesx1, dlx3b and nuerog1 was recovered; patterning of the neural plate marked by pax2a and hoxb1b was normalized; and the expression patterns of hgg1, ntl and dlx3b reflecting C&E movements were also restored. Blue bracket, gap between the hgg1 and ntl expression domains; white dotted line, neural plate border. (D) Recovery of the AP axis elongation in QKD embryos injected with one of the B1 sox mRNAs. The length of the embryos at 15–16 hpf along the AP axis between the arrowheads (Ab, Bb, Cb) was measured for the uninjected control (Ctr) (n = 7), the QKD (n = 9) and QKD with B1 sox mRNA injection (sox2, n = 9; sox3, n = 6; sox19a, n = 7; sox19b, n = 6). The average AP axis lengths with standard errors are shown. |
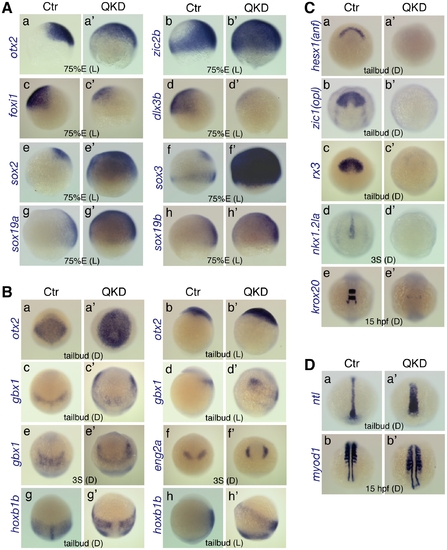
Defects in embryo patterning, early neural development, and C&E movements in the QKD embryos. Comparison of the gene expression profiles between uninjected control (Ctr) and QKD embryos. (A) Ventral expansion of early neural gene expression (otx2 [a], zic2b [b] and sox2/3/19a/19b [e–h]), and reduced expression of non-neural ectoderm marker genes (foxi1 [c] and dlx3b [d]) at 75%E. (B) Altered expression patterns of neural genes at the tailbud and 3-somite stages. The expression domains of gbx1 (c–e), eng2a (f) and hoxb1b (g, h) were anterolaterally shifted, which encompass the otx2 expression domain (a, b). (C) Defective neural development revealed by the loss of expression of neural marker genes, hesx1 (a), zic1 (b), rx3 (c), nkx1.2la (d) and krox20 (e). Residual expression of krox20 was observed in r5-derived neural crest cells. (D) Wider mesoderm structures with a shortened axis revealed by mesodermal marker genes, ntl (a) and myod1 (b). The stages and embryo orientations are shown in each panel: E, epiboly stage; S, somite stage; L, lateral view with dorsal to the right; D, dorsal view with anterior to the top. EXPRESSION / LABELING:
PHENOTYPE:
|

Defects in DV patterning and gastrulation movements in the QKD embryos. (A) DV patterning defects involving the reduced expression of bmp genes. Expression of bmp2b/7/4 (a–g) and the Bmp downstream genes gata2, szl and eve1 (h–j) is reduced in the QKD embryos. (k–s) Expression of the Bmp antagonist genes, chd and nog1, and the organizer gene gsc. All are lateral views with dorsal to the right. (B) The BMP downstream genes are restored by an exogenous supply of bmp2b/7. Embryos were injected together with the MOs for QKD and a mixture of bmp2b/7 mRNAs (20 or 40 pg each) and subjected to RT-PCR analysis at the shield stage. bactin1 was used as an RT-PCR control. (C) Decreased expression of genes regulating C&E movements in the QKD embryos. Temporal expression profiles of the indicated genes in the uninjected control and QKD embryos from the sphere to 3-somite stages were determined by RT-PCR. Expression of non-canonical wnt genes is reduced in the QKD embryos. Expression of pcdh18a/18b is also reduced in the QKD embryos, whereas cdh1, which is known to be involved in epiboly, is expressed at normal levels. bactin1 was used as an RT-PCR control. EXPRESSION / LABELING:
PHENOTYPE:
|

Impairment of neural development in the QKD embryos. (A) Altered expression of genes involved in neural differentiation. RT-PCR analysis of the indicated genes was performed as described in Figure 4C. (B) Effects of B1 sox QKD on neural bHLH gene expression. The her3 expression is totally lost in the QKD embryos (a–c), whereas ascl1a is transiently upregulated at 75%E in a broad area of the neuroectoderm (d–f). (C) The loss of cyp26a1 expression in the anterior neuroectoderm (a, b) and evidence of hindbrain patterning defects: expansion of hoxb1a expression (c) and a severe reduction of mafba expression (d). (D) The loss of expression of oep and shha/b in the neuroectoderm of the QKD embryos. (a–d) In the QKD embryos, the expression of oep is lost in the ectoderm at the shield stage (b) and the neuroectoderm at the 75%E and tailbud stages (c, d) (marked by open arrowheads in b′–d′), whereas its initial zygotic expression (a) and mesodermal expression (b–d) are maintained (closed arrowheads in a′–d′). (e) ndr2 is also expressed in the QKD mesoderm at normal levels. (f–i) The expression of shha/b in the neuroectoderm is lost (marked by open arrowheads in f′–i′), whereas that in the mesoderm is retained (closed arrowheads in f′–i′). (E) The loss of mdkb expression in the neuroectoderm and severe reduction of foxd3 expression in the neural crest cells of QKD embryos. EXPRESSION / LABELING:
PHENOTYPE:
|
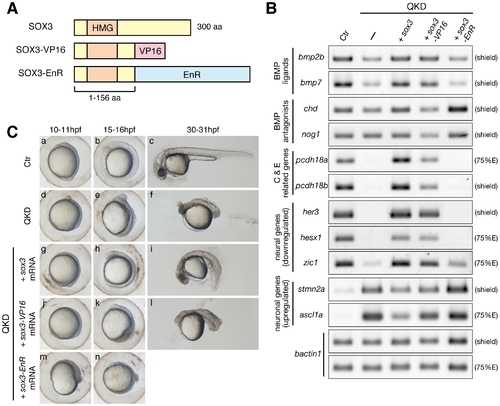
Regulatory actions of the B1 SOX proteins. (A) Schematic representation of the protein structures of SOX3, SOX3-VP16 and SOX3-EnR. Dominant activator and repressor forms of SOX3 were constructed by fusing the VP16 activation and Engrailed repression (EnR) domains, respectively, to truncated SOX3(1–156 aa). (B) Gene expression responses to SOX3, SOX3-VP16 or SOX3-EnR under QKD conditions. mRNAs of sox3, sox3-VP16 and sox3-EnR (20 pg) were individually injected with the MOs for QKD and gene expression responses were examined by RT-PCR. The exogenous supply of either SOX3 or SOX3-VP16 but not by SOX3-EnR recovered expression of genes that were downregulated (bmp2b/7, pcdh18a/18b, her3, hesx1 and zic1) in the QKD embryos and also suppressed expression of genes that were upregulated (stmn2a and ascl1a). bactin1 was used as an RT-PCR control. (C) Partial rescue by SOX3-VP16 and strengthening by SOX3-EnR of the morphological phenotypes of the QKD embryos. Live embryo images at 10–11, 15–16, and 30–31 hpf were observed. SOX3-VP16-injected embryos showed a rather ventralized phenotype. Embryos coinjected with SOX3-EnR died during late segmentation stages. All are lateral views. |
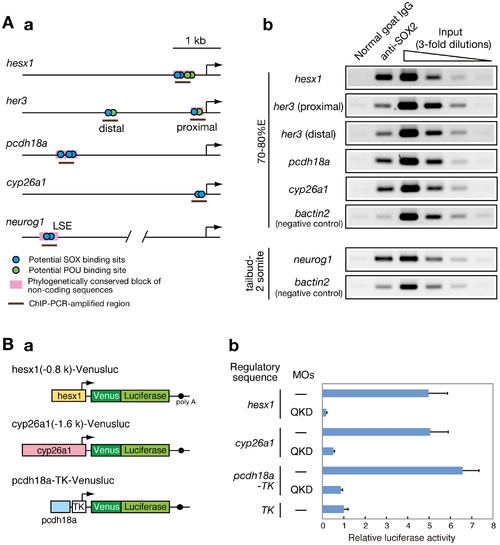
Direct regulatory targets of the B1 SOX proteins in the zebrafish embryo. (A) ChIP analysis showing direct association of B1 SOX with regulatory sequences of the downstream genes. (a) Potential binding sites for SOX and POU within the analyzed genomic regions are schematically shown. (b) ChIP-PCR analysis using anti-SOX2 antibody. ChIP experiments were performed using zebrafish embryos at the 70–80%E and tailbud to 2-somite stages. ChIP-PCR analysis using anti-SOX2 antibody that weakly cross-reacts with SOX3/19A/19B revealed specific binding of B1 SOX to the regulatory sequences of the hesx1, her3, pcdh18a, cyp26a1 and neurog1 genes in the zebrafish embryo. bactin2 was used as a negative control. (B) B1 SOX-dependent activities of the regulatory sequences of hesx1, cyp26a1 and pcdh18a. (a) The Venusluc fusion reporter (Venus plus firefly luciferase) constructs containing either of the promoters for hesx1 or cyp26a1 or the upstream conserved sequence of pcdh18a with the HSV TK promoter are schematically shown. (b) The Venusluc reporters were injected into embryos with or without the MOs for QKD together with the reference vector TK-Renilla luciferase. More than 20 injected embryos per sample were collected at the tailbud stage, and luciferase assays were performed. The normalized luciferase activity generated by TK-Venusluc was arbitrarily assigned a value of 1. Data are shown as the average values of four independent injection experiments with standard errors. |
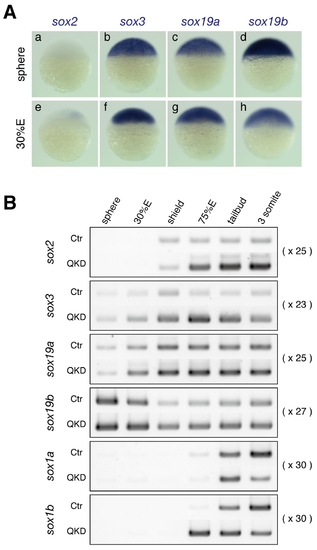
Expression of group B1 sox genes in zebrafish embryos. (A) Expression of the sox2, sox3, sox19a and sox19b genes in zebrafish embryos at the sphere and 30%E stages, visualized by whole-mount in situ hybridization. (B) Expression profiles of the B1 sox genes in uninjected control (Ctr) and QKD embryos from the sphere to 3-somite stages determined by RT-PCR. The amplification cycles used are indicated on the right. bactin1 was used as an RT-PCR control and is shown in Figure 4C. |
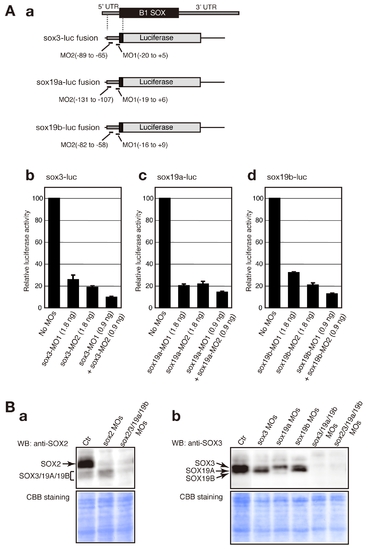
Evaluation of the knockdown efficiency of MOs targeting sox2, sox3, sox19a and sox19b. (A) Quantitative evaluation of the knockdown efficiency of MOs targeting sox3, sox19a and sox19b using a luciferase assay. (a) Schematic representation of sox3-luc, sox19a-luc and sox19b-luc fusion RNA constructs. (b–d) Inhibition levels caused by the injection of sox3-MOs (b), sox19a-MOs (c) and sox19b-MOs (d) were quantitatively measured using the luciferase assay-based system. Luciferase activity was measured using more than 20 injected embryos of the tailbud to early somite stages per sample. The luciferase activity generated by each sox-luc fusion in the absence of MOs was arbitrarily assigned a value of 100. Data are shown as the average values of three independent injection experiments with standard errors. (B) Inhibition of endogenous B1 SOX expression analyzed by western blotting. Lysates for SDS-PAGE were prepared using tailbud to early somite stage embryos that had been injected with the indicated MOs. The knockdown conditions were the same as those described in Figure 1. A seven-embryo equivalent amount of the lysate was used per lane. Western blotting was performed using an anti-SOX2 antibody that weekly cross-reacts with SOX3/19A/19B (a) and an anti-SOX3 antibody that preferentially detects SOX3/19A/19B (b). Note that the SOX19B expression levels are low at these stages. |
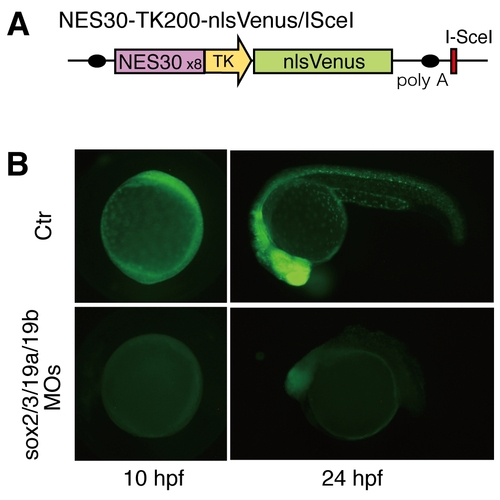
B1 sox activity is efficiently eliminated from the zebrafish embryo by B1 sox QKD. (A) Schematic representation of the NES30-TK200-nlsVenus/ISceI transgene construct used. NES30 is the 30-bp nestin enhancer core sequence, which is composed of SOX and POU binding sites. (B) NES30-driven nlsVenus expression (controls in upper panels) was abolished by injection of the MOs for QKD (lower panels), confirming effective depletion of B1 SOX activity from the embryo. |
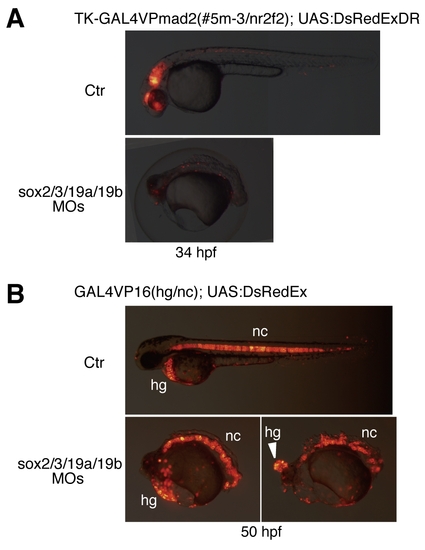
Effects of the B1 sox QKD revealed using transgenic lines with the GAL4-medeated reporter expression in the CNS and axial mesoderm. (A) Effects of QKD on CNS development were examined using the GAL4 enhancer trap line, which reports the activity of nr2f2 (couptfβ) neural enhancers. Double transgenic embryos harboring GAL4VPmad2 (#5m-3) and UAS:DsRedExDR normally show reporter expression in the CNS, which mimics neural nr2f2 expression. Injection of the MOs for QKD abolished this reporter expression, indicating impairment of CNS development. (B) Effects of QKD on axial mesoderm development, examined using the GAL4VP16(hg/nc) line. Double transgenic embryos harboring the GAL4VP16(hg/nc) transgene and UAS:DsRedEx show reporter expression in the hatching gland (hg) and notochord (nc). Strong expression of UAS:DsRedEx was observed after 1 dpf in this line. Injection of the MOs for QKD did not reduce reporter expression, indicating normal axial mesoderm differentiation in the morphants. However, hatching gland cells remained as a single ball-like structure in the heads of the severe morphants (arrowhead). |
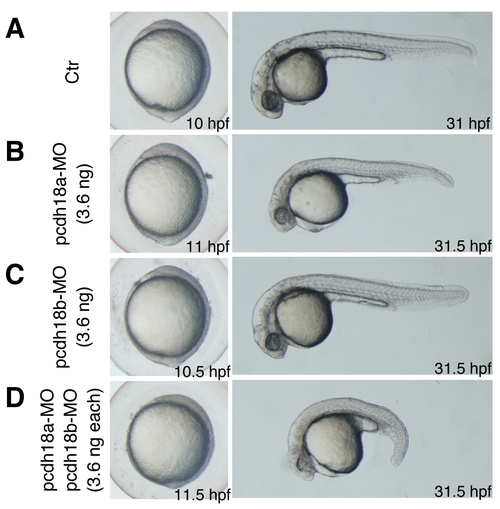
Phenotypes of pcdh18a and pcdh18b knockdowns. Bright-field images of live embryos at 10–11.5 hpf and 31–31.5 hpf are shown. (A) Uninjected control (Ctr) embryos. (B–D) Single and double knockdowns of pcdh18a/18b. Moderate amounts of MO (3.6 ng) were used for single KD (B,C) and a 1:1 mixture of two MOs (3.6 ng each) was injected for double KD (D). Double knockdown embryos showed a shorter anteroposterior axis than the single knockdown embryos, indicative of more severe defects in C&E movements and suggesting a degree of functional redundancy between pcdh18a and pcdh18b. |

Expression of stmn2a and pou5f1 in the QKD embryos. (A) Expression of the stmn2a gene is upregulated in the QKD embryos at the shield stage. (B) Expression levels of pou5f1 were not affected in the B1 sox QKD embryos (our microarray data), whereas its expression domain was ventrally expanded at 75%E. |