
- Title
-
Proneural gene-linked neurogenesis in zebrafish cerebellum
- Authors
- Kani, S., Bae, Y.K., Shimizu, T., Tanabe, K., Satou, C., Parsons, M.J., Scott, E., Higashijima, S.I., and Hibi, M.
- Source
- Full text @ Dev. Biol.

Expression of proneural genes during cerebellar development. (A–S) Expression of atoh1a (A–E), atoh1b (F–J), atoh1c (K–N), and ptf1a (O–S) at dpf 1 (A, F, O), 2 (B, G, K, P), 2.5 (C, H, L, Q), 3 (D, I, M, R), and 5 (E, J, N, S). Dorsal views with rostral to the left. (Ba–c, Pa–c) Parasagittal (a) and cross sections (b, c) at the levels indicated in (B) and (P). (T–W) Co-staining of atoh1a and ptf1a expression at 3 (T, U) and 5 dpf (V, W). Dorsal views (T, V) and sagittal sections (U, W) at the levels indicated in (T) and (V). (X) Schematic representation of expression of atoh1a (light green), atoh1b (green), atoh1c (dark green), and ptf1a (pink) at 2 and 5 dpf. Ca, cerebral aqueduct; CCe, corpus cerebelli; EG, eminentia granularis; LCa, lobus caudalis cerebelli; LRL, lower rhombic lip; TeO, tectum opticum; URL, upper rhombic lip; Va, valvula cerebelli; VZ, ventricular zone; 4th V, fourth ventricle. Scale bars: 200 μm (A, T), 100 μm (Ba, Bb, U). |
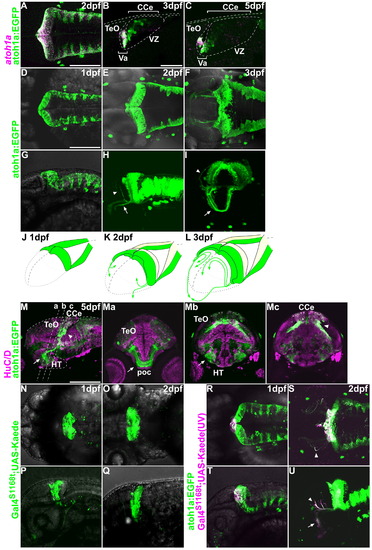
Behaviors of neurons derived from atoh1a+ neuronal progenitors. (A–C) Expression of atoh1a mRNA (magenta) and EGFP (atoh1a:EGFP, green) in the cerebellum of Tg(atoh1a:EGFP) fish at 2, 3, and 5 dpf. Dorsal view (A) and parasagittal sections (B, C), with rostral to the left. Note that the atoh1a:EGFP signals overlap those of the atoh1a transcripts at 2 dpf in the valvula cerebelli (Va) but not the corpus cerebelli (CCe). The atoh1a-, atoh1a:EGFP+ cells are descendants of atoh1a+ progenitors. (D–J) Expression of atoh1a:EGFP at 1 (D, G), 2 (E, H), and 3 dpf (F, I). Dorsal (D–F), lateral (G, H), antero-lateral (I) views. Arrows and arrowheads indicate axonal projections to the optic tectum and hypothalamus, respectively (H, I). (J-L) Schematic representation of atoh1:EGFP+ cells and their projections at 1 (J), 2 (K), and 3 dpf (L). (M) Expression of atoh1a:EGFP (green) and HuC/D (magenta) at 5 dpf. Sagittal section (M). (Ma, b, c) Cross sections at the levels indicated in (M). Arrows indicate tegmental nuclei derived from the URL, which include secondary gustatory nucleus (SGN). Projections from the atoh1a:EGFP+ SGN are indicated by arrowheads. (N–U) Lineage tracing of the rostro-medial atoh1a+ cells using the photoconvertible protein Kaede. Green (non-photoconverted) Kaede was detected in the rostral cerebellum in Et(fos:Gal4-VP16)s1168t; Tg(UAS-E1b: Kaede)s1999t at 1 (N, P) and 2 dpf (O, Q). The tectum and cerebellum are indicated by dotted lines (Q). The green fluorescent Kaede in the rostro-medial cerebellum was converted to a red fluorescent protein (magenta) by UV irradiation at 24 hpf in Et(fos:Gal4-VP16)s1168t; Tg(UAS-E1b: Kaede)s1999t; Tg(atoh1a:EGFP) (R-U). The Kaede expression overlapped with that of atoh1a:EGFP in the rostro-medial cerebellum (R, T, and Suppl. Fig. 2). These rostro-medial cells migrated ventro-laterally (S, U, and Suppl. Fig. 3) were located at the bottom of the cerebellum, and projected to the optic tectum (arrowheads) and hypothalamus (arrow). These cells were located in the tegmentum at 5 dpf (M). HT, hypothalamus; poc, postoptic commissure. Other abbreviations are the same as in Fig. 1. Scale bars: 100 μm (B, D), 200 μm (M). |

Behavior of granule cells. (A–D) Expression of neurod at 3 (A, B) and 5 (C, D) dpf. Dorsal views (A, B, C, D) and sagittal sections at the levels indicated in B and D (Ba, Da, Db). Neurod+ mature granule cells in the granule cell layer are marked by arrows. (E, F) Expression of atoh1a:EGFP (green) and Neurod (magenta) at 3 (E) and 5 dpf (F, G). Sagittal sections at the levels comparable to Ba (for E), Da (for F), and Db (for G). atoh1a:EGFP+ Neurod+ cells are marked by arrows. (H–K) BrdU incorporation at 3 dpf. Tg(atoh1a:EGFP) (H) or wild-type larvae (I–K) were labeled with bromodeoxyuridine (BrdU) for 1 h, and proliferating cells were analyzed by immunostaining with anti-BrdU (magenta in H and K; brown in I and J) antibody, and anti-EGFP (green, H), anti-Neurod (green, K) antibodies, atoh1b (I) or atoh1c (J) riboprobes sagittal sections. The larvae were stained with anti-BrdU (magenta) and anti-Neurod (green) antibodies. Cells that were positive both for BrdU signals and proneural gene expression are marked by arrows. (L, M) Birthdate analysis. Larvae were labeled with BrdU at 5 dpf and fixed 1 h after the labeling (L) or at 7 dpf (two days after the labeling, M). Dorsal view (L) and sagittal sections at the mediolateral level (La and M). BrdU+ Neurod+ cells are marked by arrows. (N) Schematic representation of granule cell development during the larval period. TeO, tectum opticum; GCL, granule cell layer; other abbreviations are described in Fig. 1. Scale bars: 50 μm (Ba, E, H), 100 μm (L), 200 μm (A, B). EXPRESSION / LABELING:
|
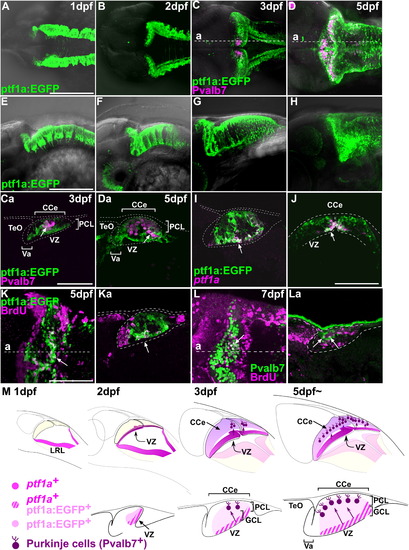
Differentiation and migration of GABAergic neurons. (A–H) Expression of ptf1a:EGFP (green) and Pvalb7 (magenta) in the cerebellum at 1, 2, 3, and 5 dpf. Dorsal views (A–D), lateral views (E–H) with rostral to the left. (Ca, Da) Parasagittal sections at the levels indicated in (C) and (D). Note that many cells were positive for both ptf1a:EGFP and Pvalb7 (arrows, Ca, Da) (I, J) Parasagittal (I) and cross-sectional (J) views showing the expression of ptf1a mRNA (magenta) and ptf1a:EGFP (green) at 5 dpf. Most cells in the VZ were both ptf1a+ and ptf1a:EGFP+ (arrows). ptf1a- ptf1a:EGFP+ cells found superficial to the VZ were immature neurons derived from the ptf1a+ neural progenitors in the VZ. (K) BrdU incorporation. Tg(ptf1a:EGFP) fish were labeled with BrdU at 5 dpf for 1 h, and proliferating cells were analyzed by immunostaining with anti-BrdU (magenta) and anti-EGFP (green) antibodies. Dorsal stacking view (K) and parasagittal section (Ka) are shown. BrdU signals were detected in ptf1a:EGFP+ cells in the VZ (arrows). (L) Birthdate analysis. Larvae were labeled with BrdU at 3 dpf and fixed at 7 dpf. The larvae were stained with anti-BrdU (magenta) and anti-Pvalb7 (green) antibodies. Dorsal stacking view (L) and parasagittal section (La) are shown. Note that BrdU signals were detected in Pvalb7+ Purkinje cells (arrows). (M) Schematic representation of development of GABAergic neurons. PCL, Purkinje cell layer; other abbreviation is described in [Fig. 1] and [Fig. 3]. Scale bars: 50 μm (Ca, J), 100 μm (K), 200 μm (A, E). EXPRESSION / LABELING:
|

Coordinated migration and expansion of glutamatergic and GABAergic neurons in the larval cerebellum. (A–I) Tracing of the glutamatergic and GABAergic lineages. Tg(UAS-E1b:NfsB-mCherry); Tg(ptf1a:Gal4VP16) fish (Tg(ptf1a:G4-U:mCherrry)) were crossed with Tg(atoh1a:EGFP) to mark the lineages of cells derived from atoh1a+ or ptf1a+ neuronal progenitors. The expression of EGFP (glutamatergic lineage) and mCherry (GABAergic lineage) was analyzed on dpf 2 (A, D, G), 3 (B, E, H), and 5 (C, F, I). Dorsal stacking views with rostral to the left (A-F), and lateral views of optical sections (G, H), and a histological section (I) are shown. (J) Schematic representation of the development of the two lineages. At 2 dpf, atoh1a+ glutamatergic and ptf1a+ GABAergic progenitors occupy, respectively, the anterior and posterior domains, of the cerebellum. From 3 to 5 dpf, atoh1a+ progenitors generate atoh1a:EGFP+ granule cells in the ML, which become Neurod+ immature granule cells and migrate to the granule cell layer; ptf1a:EGFP+ cells migrate dorsally from the VZ and become differentiated into Purkinje cells at the Purkinje cell layer. These processes generate the three cerebellar layers visible at 5 dpf. The abbreviations are defined in [Fig. 1], [Fig. 3] and [Fig. 4]. Scale bars: 50 μm (G, H, I), 100 μm (D), 200 μm (A). |

Differentiation and migration of olig2+ eurydendroid cells. (A–F) Expression of olig2 (B, D, F) and olig2:EGFP (A, C, E) in the cerebellum at 2, 3, and 5 dpf. Dorsal views with rostral to the left. (G–J) Expression of olig2:EGFP and vglut2:DsRed at 3 (G, H) and 5 (I, J) dpf. EGFP and DsRed signals in Tg(olig2:EGFP); Tg(vglut2a:DsRed) were detected with anti-EGFP (green) and anti-DsRed (magenta) antibodies, respectively. (H, J) Sagittal sections at the levels indicated in G and I, respectively. The olig2:EGFP+ cells in the VZ were negative for vglut2a:DsRed (arrowheads), but in the GCL and PCL domains, most olig2:EGFP+ cells were positive for vglut2a:DsRed (arrows). (K–O) Expression of olig2:EGFP and ptf1a:Gal4VP16; UAS:NfsB-mCherry (ptf1a:G4-U:mCherry) at 2 dpf (K, L), 5 dpf (M, N), and the adult cerebellum (O). (K, M) Dorsal views; (L) high-magnification view of the box in (K); (N) sagittal section at the level indicated in (M); (O) sagittal section. Note that most olig2:EGFP+ cells were also positive for ptf1a:G4-UAS:mCherry at 2 dpf (arrows), but many of them became negative after differentiation at 5 dpf. olig2:EGFP+ ptf1a:G4-U:mCherry+ cells were also detected in the VZ at 5 dpf and adult stage (arrowheads). (P-S) Expression of olig2:EGFP and atoh1a:dTomato at 2 (P, Q) and 5 (R, S) dpf. (Q, S) High-magnification views of the boxes in (P, R). The olig2:EGFP+ cells located in the lateral domains were positive for atoh1a:dTomato (arrows). (T) Schematic representation of development of the olig2+ eurydendroid cells. The abbreviations are defined in Fig. 1. Scale bars: 50 μm (H, S), 100 μm (L), 200 μm (A, B, G, K, O, P). |

Expression of proneural genes in juvenile and adult cerebellum. Expression of atoh1a, atoh1b, atoh1c, and ptf1a in cerebellum at late larval (15 dpf, A–F), juvenile (30 dpf, G–J), and adult (90 dpf or older, K–Q) stages by in situ hybridization. Sagittal sections, at paramedian (A–D, K–N) or median (E, F, O–Q) levels. Whole-mount in situ hybridization with dorsal views (G–J). Note that the expression domains of atoh1b and atoh1c in the midline are very thin, and were not detected by whole mount in situ hybridization (H, I). (R) Schematic representation of atoh1a, atoh1b, atoh1c, and ptf1a expression in the adult cerebellum. The abbreviations are defined in [Fig. 1] and [Fig. 3]. Scale bars: 100 μm (A), 500 μm (G), 1 mm (K). EXPRESSION / LABELING:
|

Expression of proneural genes associates with cell proliferation in the adult cerebellum. (A–D) BrdU incorporation in atoh1a, atoh1b, atoh1c, or Neurod-expressing cells. Adult (about 3 months old) Tg(atoh1a:EGFP) or wild-type fish were labeled with BrdU for 1 h, and proliferating cells were analyzed by immunostaining with anti-BrdU antibody (magenta in A; brown in B and C), and anti-EGFP (green, A), anti-Neurod (green, D) antibodies, or atoh1b (purple, B) or atoh1c (purple, C) probes. Parasagittal (A) and sagittal sections near the midline (B–D). (Aa, Ba, Bb, Ca, Cb, and Da) High-magnification views of the boxes in (A–D). (E) Birthdate analysis of granule cells. Adult fish were labeled with BrdU and fixed 5 days after labeling (day 5). The cerebellum was stained with anti-BrdU (magenta) and Neurod (green) antibodies. Sagittal section. (Ea) High-magnification view of the box in (E). BrdU+, Neurod+ granule cells were detected in the molecular layer 1 h after labeling (arrows, Da), but were in the GCL at day 5 (arrows, Ea). (F) BrdU incorporation in ptf1a-expressing cells. Sagittal section (F) and high magnification view (Fa). BrdU+, ptf1a:EGFP+ cells were detected in the VZ (arrow). (G, H) Birthdate analyses of GABAergic lineage. Adult Tg(ptf1a:EGFP) (G) or wild-type (H) fish were labeled with BrdU, and the cerebellum was stained with anti-EGFP (G) or anti-Pvalb7 (H) antibodies on day 5. Sagittal sections (G, H) and high-magnification view (Ga). Many of the BrdU-positive cells stayed in the VZ (arrow, Ga), but BrdU+, Pvalb7+ Purkinje cells were detected (arrows, H) on day 5. (I) BrdU incorporation in blbp-expressing Bergmann glia. Sagittal section through the Va and the rostral CCe (I) and high-magnification view (Ia). Note that blbp signals overlap with the BrdU signals. The abbreviations are defined in [Fig. 1] and [Fig. 3]. Scale bars: 50 μm (Aa, Ea), 100 μm (Ba, Da, E, Ia), 200 μm (D, Fa, H), 500 μm (A, Ba, F), 1 mm (B, I). EXPRESSION / LABELING:
|

atoh1a:EGFP is expressed in secondary gustatory nucleus. Expression of atoh1a:EGFP (A) and EGFP mRNA (B) of adult Tg(atoh1a:EGFP) fish. Immunostaining (A) and in situ hybridization. Sagittal sections with rostral to the left. The atoh1a:EGFP was detected in the nucleus underneath the cerebellum, which corresponds to secondary gustatory nucleus (SGN) in the tegmentum. Scale bar: 200 μm. |
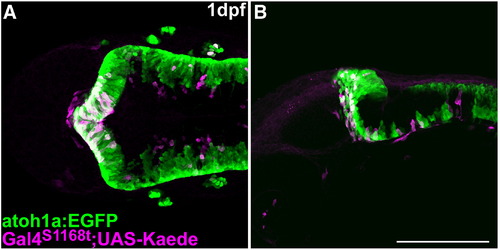
Characterization of Et(fos:Gal4-VP16)s1168t:Tg(UAS-E1b: Kaede)s1999t. Expression of atoh1a:EGFP (green) and Kaede (magenta) in Et(fos:Gal4-VP16)s1168t; Tg(UAS-E1b: Kaede)s1999t; Tg(atoh1a:EGFP) at 1 dpf. Immunostaining with anti-GFP and anti-Kaede antibodies. Dorsal (A) and lateral (B) views with rostral to the left. Kaede was detected in the tectum and the atoh1a:EGFP+ rostral cerebellum. Scale bar: 200 μm. |
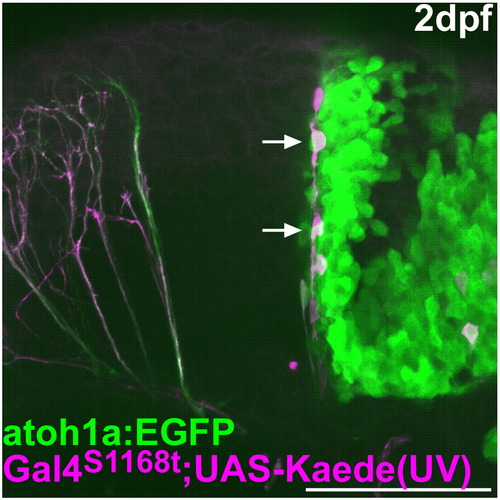
Lineage tracing of the rostro-medial atoh1a+ cells. As described in Fig. 2, the green Kaede in the rostral cerebellum was converted to a red fluorescent protein (magenta) by UV irradiation at 24 hpf in Et(fos:Gal4-VP16)s1168t; Tg(UAS-E1b: Kaede)s1999t; Tg(atoh1a:EGFP). The atoh1a:EGFP and the red Kaede were detected at 2 dpf. Lateral view with rostral to the left. The cells migrating ventro-laterally from the rostro-medial cerebellum are marked by arrows. Scale bar: 100 μm. |
Reprinted from Developmental Biology, 343(1-2), Kani, S., Bae, Y.K., Shimizu, T., Tanabe, K., Satou, C., Parsons, M.J., Scott, E., Higashijima, S.I., and Hibi, M., Proneural gene-linked neurogenesis in zebrafish cerebellum, 1-17, Copyright (2010) with permission from Elsevier. Full text @ Dev. Biol.