
- Title
-
Basonuclin-2 requirements for zebrafish adult pigment pattern development and female fertility
- Authors
- Lang, M.R., Patterson, L.B., Gordon, T.N., Johnson, S.L., and Parichy, D.M.
- Source
- Full text @ PLoS Genet.
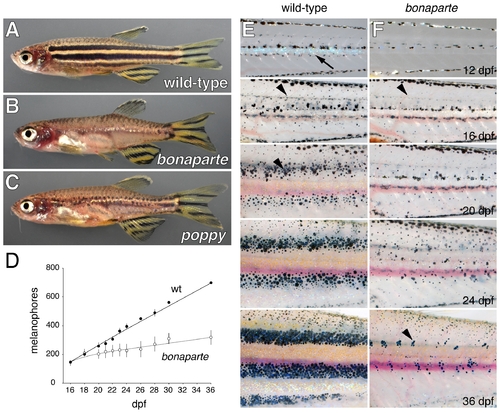
bonaparte and poppy mutants have fewer metamorphic melanophores, xanthophores, and iridophores. (A) Wild-type adult zebrafish. (B) bonaparte mutants lack melanophore and xanthophore stripes on the body but retain stripes in the caudal and anal fins and exhibit a normal pattern of scale melanophores. A few residual iridophores are evident near the horizontal myoseptum. Internal viscera are partially visible owing to the absence of melanophores and iridophores. (C) poppy mutants retain partial stripes of melanophores on the body as well as the fins. (D) Time course illustrating the increasingly severe deficit of melanophores (means±SE) in bonaparte homozygotes as compared to phenotypically wild-type bonaparte/+ siblings followed daily between 16 and 36 days post-fertilization (dpf; n = 1 to 3 fish for each genotype across all days). (E,F) Images of individual wild-type (bonaparte/+) and bonaparte larvae from the onset of pigment pattern metamorphosis (here, 12 dpf) through completion of the adult pigment pattern (36 dpf). bonaparte mutants lack early appearing metamorphic iridophores (arrow in E at 12 dpf), but develop dispersed metamorphic melanophores (arrowheads in (E) and (F) at 16 dpf). Subsequently, bonaparte mutants do not develop nascent adult stripes as in wild-type (arrowhead in (E) at 20 dpf) and exhibit only residual clusters of melanophores on the flank (arrowhead in (F) at 36 dpf) when wild-type fish exhibit fully formed adult stripes. PHENOTYPE:
|
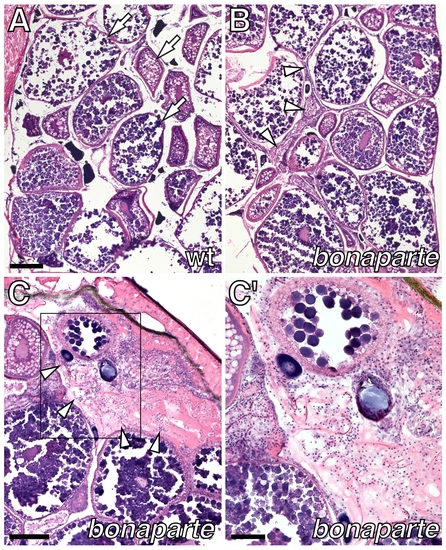
Female infertility and ovarian dysmorphology in bonaparte mutants. (A) Cross-section through adult wild-type ovary stained with hematoxylin and eosin, showing oocytes at various stages of development (arrows). (B) Corresponding region of bonaparte ovary showing oocytes as well as increased amounts of somatic tissue (arrowheads). (C) Detail of a bonaparte ovary showing somatic tissue (arrowheads). (C′) Inset in C. Scale bars: in (A), 200 μm for (A,B); in (C), 200 μm; in (C′), 100 μm. PHENOTYPE:
|
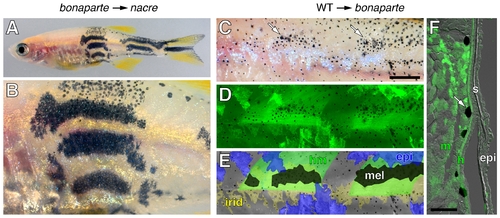
bonaparte is required non-autonomously to melanophores. (A,B) bonaparte melanophores consistently formed wild-type stripes in melanophore-free nacre (bonaparte+) hosts (n = 8). Shown are low magnification (A) and higher magnification (B) views of the same individual. (C–F) bonaparte mutant melanophores consistently formed larger and denser spots when adjacent to wild-type (GFP+) myotome and hypodermal cells. Shown is a single individual. Melanophores were more spread and patches were larger (arrows in C) and such patches were found above wild-type (GFP+) muscle (n = 3) (D). In this individual, no wild-type melanophores developed, but muscle and epidermis occurred in both overlapping and non-overlapping regions and patches of bonaparte mutant melanophores corresponded more closely to the location of muscle than of epidermis. Distributions are shown schematically in E; hm, hypodermal cells and muscle; epi, epidermis; mel, melanophores; irid, iridophores. Melanophore patches were identified by the greater density and more spread morphology of melanophores in fish prior to epinephrine treatment, which causes melanosome translocation towards cell bodies facilitating GFP detection in melanophores and other tissues. The individual shown has not yet fully contracted melanosomes in all melanophores. (F) In transverse section, melanophores (arrow) were adjacent to GFP+ muscle (m) as well as a thin layer of hypodermal cells (h), that cannot be seen in whole mount. Scale bars: in (C), 100 μm for (C–E); in F, 100 μm. |
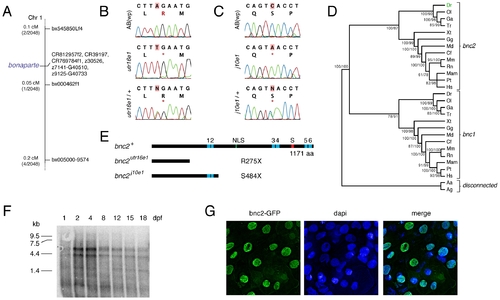
bonaparte and poppy are mutant alleles of basonuclin-2 (bnc2). (A) Mapping of bonaparte to chromosome 1. (B,C) Identification of premature stop codons in bnc2 alleles of bonaparte (B) and poppy (C). Shown are wild-type ABwp alleles, homozygous mutant alleles, and heterozygous mutant alleles. *, stop codon. (D) Phylogenetic analysis places zebrafish bnc2 within the clade of other vertebrate bnc2 loci. Values in at nodes are bootstrap support based on 1,000 replicates (PAUP heuristic parsimony analysis) followed by posterior probabilities from Bayesian analysis. Abbreviations: Dr, Danio rerio; Ol, Oryzias latipes; Ga, Gasterosteus aculeatus; Tr, Takifugu rubripes; Xt, Xenopus tropicalis; Gg, Gallus gallus; Md, Monodelphis somestrica; Cf, Canis familiaris; Mm, Mus musculus; Rn, Rattus norvegicus; Mam, Macaca mulatta; Pt; Pan troglodytes; Hs, Homo sapiens; Aa, Aedes aegypti; Ag, Anopheles gambiae. (E) Domain structure of bnc2 and predicted truncated proteins. (F) Northern blot of poly(A)+ mRNA extracted from whole fish at the times indicated and probed with a full length bnc2 RNA probe. Two major bnc2 isoforms were detected. Equal loading verified by Nanodrop spectrophotometry and β-actin control probe (not shown). (G) bnc2-GFP fusion protein shows nuclear localization in embryo epidermis at 24 hours post-fertilization. EXPRESSION / LABELING:
|
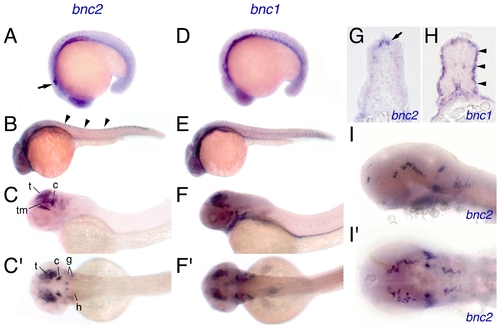
Embryonic expression of bnc2 and bnc1. (A) At 18 hpf, bnc2 was expressed broadly in ectodermal and mesodermal tissues with particular expression visible in otocyst (arrow). (B) At 24 hpf, bnc2 transcript was present within the dorsal neural tube (arrowheads) and within the anterior central nervous system. (C,C′) At 48 hpf, strong bnc2 expression was limited to the brain and cranial ganglia shown in lateral (C) and dorsal (C′) aspects. t, tectum; tm, tegmentum; c, cerebellum; g, cranial ganglia; h, hindbrain neurons. (D) bnc1 was expressed similarly to bnc2 at 18 hpf. (E) At 24 hpf, bnc1 transcripts were seen in the myotomes and throughout the head anteriorly. (F,F′) At 48 hpf, bnc1 was expressed widely at low levels and at higher levels within the brain, cranial ganglia, and pronephric duct. (G) In transverse section at 24 hpf, bnc2 transcript was present in the dorsal neural tube (arrow). (H) Simultaneously, bnc1 transcript could be seen lining the outer edges of the myotome (arrowheads). (I,I′) Details of the bnc2 expression in the brain and cranial ganglia at 36 hpf, from laterally (I) and dorsally (I′). EXPRESSION / LABELING:
|
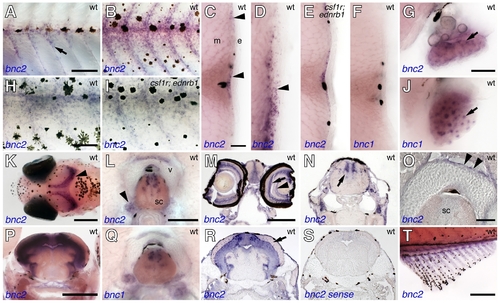
bnc2 and bnc1 expression in diverse tissues during the larval-to-adult transformation. (A) bnc2 transcript was seen in hypodermal cells during early stages of pigment pattern metamorphosis (7.0 mm standardized standard length; 7 SSL [79]). (B) bnc2+ cells were more widely scattered over the flank during middle stages of pigment pattern metamorphosis (∼10 mm SL). (C) In cross sections, bnc2+ cells (purple stained, arrowheads) occurred at the level of the hypodermis, near the horizontal myoseptum as well as further dorsally and ventrally (∼9 mm SL). Black melanophores also were present in the epidermis (e) and myotome (m). (D) In further ventral regions at the same stage, bnc2+ cells were present both within the hypodermis and in the epidermis (arrowhead). (E) The distribution of bnc2+ cells in csf1r; ednrb1 double mutants was similar to that of wild-type, suggesting bnc2+ cells are not xanthophores or iridophores. (F) In contrast, bnc1 was not expressed in the skin or hypodermal region at comparable stages as detectable by in situ hybridization. (G) In the ovary, bnc2 was expressed by somatic cells (arrow). (H,I) Higher magnification views of bnc2 expression at 10 SSL in wild-type (H) and csf1r; ednrb1 double mutants (I), with similar staining patterns. (J) In contrast to bnc2, bnc1 transcript was seen in ovarian oocytes. (K) Dorsal head of 9 SSL larva showing bnc2 expression in the brain (arrowhead). (L) bnc2+ cells in dorsal spinal cord (sc), ganglia (arrowhead), and dorsal superficial cells of vertebral centrum (v). (M) Transverse cryosection through the head revealed expression in the eye, including the inner nuclear layer and ganglion cell layer (arrow and arrowhead, respectively) and in the diencephalon. (N) Cryosection showing bnc2 staining in the hindbrain (arrow). (O) Detail showing staining of superficial cells of centrum (arrowheads). (P) Transverse vibratome section through midbrain showing bnc2+ cells in periventricular grey zone (PGZ) of the tectum. (Q) Staining for bnc1 in dorsal spinal cord. (R). Cryosection through midbrain showing broad staining within the PGZ as well as individual scattered bnc2+ cells within the tectum (arrow). (S) bnc2 sense control probe. (T) bnc2 was also expressed in the fins, including the anal fin shown here (∼12 SSL). Scale bars: in (A), 100 μm for (A,B); in (H), 50 μm for (H,I); in (C), 20 μm for (C–F); in (G), 40 μm for (G,J); in (K), 200 μm; in (L), 50 μm, for (L,Q); in (M), 200 μm for (M,N,R,S); in (O), 20 μm; in (P), 200 μm; in (T), 200 μm. EXPRESSION / LABELING:
|
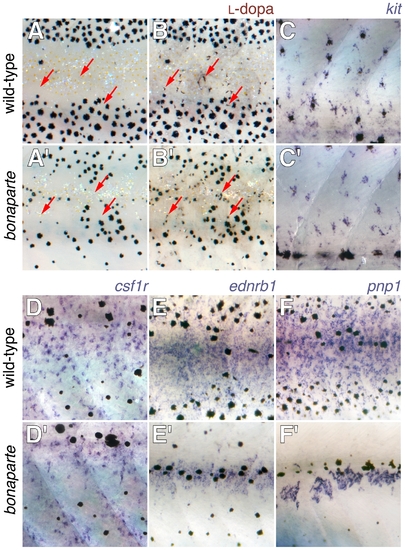
Pigment cell specification and early differentiation in bonaparte (bnc2) mutants. Shown are corresponding views from the flanks of mid-metamorphic 8–10 SSL larvae with wild-type above and bonaparte (bnc2) mutants below. (A,B) Staining with L-dopa revealed previously cryptic cells that are competent to synthesize melanin (arrows) in both wild-type and mutant. (A,A′) Prior to staining. (B,B′) After staining. (C,C′) kit+ melanoblasts were detectable in both wild-type and bonaparte mutants. (D,D′) csf1r+ xanthophore precursors were found in both backgrounds. (E,E′) ednrb1+ cells that may be iridophores as well as other chromatophore precursors are present though fewer in bonaparte. (F,F′) purine nucleoside phosphorylase 1 (pnp1) expressing iridophore precursors (DMP unpublished data) are present though dramatically reduced in number in bonaparte. EXPRESSION / LABELING:
PHENOTYPE:
|
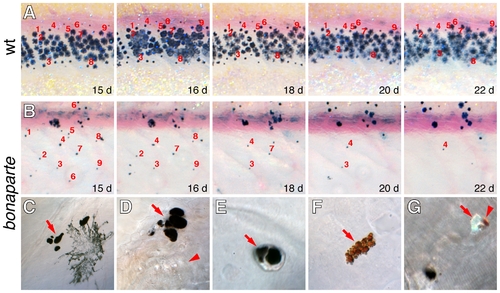
bnc2 is required for survival of melanophores, xanthophores, and iridophores. Shown are repeated images from single larvae, with specific cells numbered. (A) In wild-type, individual cells could be followed through adult stripe formation. (B) In bonaparte mutants, individual cells were lost over a period of several days, corresponding to late stages of pigment pattern metamorphosis (11–14 SSL). (C–G) Higher magnification views showing chromatophore death and extrusion in bonaparte mutants. (C) Melanin-containing cellular fragments beneath the skin (arrow), adjacent to an intact melanophore. (D) A cluster of melanin-containing fragments at the surface of the epidermis (arrow), adjacent to a lateral line neuromast (arrowhead). (E) Melanin-containing extrusion body (arrow) that has just been extruded but is still adherent to the outer epidermis. (F) Pteridine and carotenoid-containing cellular debris at the epidermal surface, indicative of xanthophore loss. (G) Extrusion bodies contaiing melanin (lower left) as well as single body containing both xanthophore pigment and iridophore reflecting platelets (arrowhead and arrow, respectively). Typically, at least ten extrusion bodies could be found per individual examined. PHENOTYPE:
|
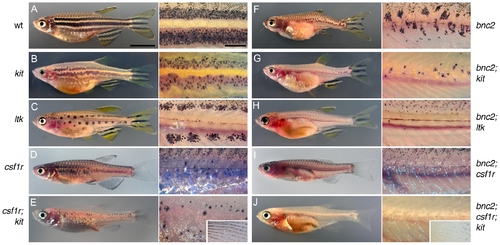
bnc2 promotes both early and late metamorphic stripe melanophores, but is required by fin melanophores only in the absence of csf1r and kit. Shown on the left are wild-type (A), the single mutant phenotypes of kit (B), ltk (C), csf1r (D) and the double mutant phenotype of csf1r; kit (E). Shown on the right is bonaparte (bnc2) (F) and the corresponding double and triple mutants with bonaparte (G–J). Whole fish images as well as details of the flank are shown. kit mutants lack EM melanophores but retain LM melanophores; kit mutants and all combinations with kit also lack scale melanophores [e.g., arrowhead in (B)]. ltk mutants lack both LM melanophores and body iridophores, but retain EM melanophores. csf1r mutants lack LM melanophores and all xanthophores, but retain EM melanophores in a dispersed pattern. csf1r; kit double mutants lack nearly all hypodermal body melanophores and lack all xanthophores, but retain melanophores in the fins (inset). All double and triple mutant combinations with bonaparte exhibited fewer hypodermal melanophores than the corresponding non-compound mutants. Remaining body melanophores are almost entirely found in association with scales (e.g., arrowheads in H′). bnc2; csf1r; kit mutants lacked virtually all body chromatophores and exhibited only a few residual melanophores at the tips of the fins (arrow), as well as a “medallion” of iridophores over the cardiac region. Scale in (A), 5 mm for (A–J); scale in (A′), 2 mm for (A′–J′). PHENOTYPE:
|

Unillustrated author statements EXPRESSION / LABELING:
|