
- Title
-
Visualization of myelination in GFP-transgenic zebrafish
- Authors
- Jung, S.H., Kim, S., Chung, A.Y., Kim, H.T., So, J.H., Ryu, J., Park, H.C., and Kim, C.H.
- Source
- Full text @ Dev. Dyn.
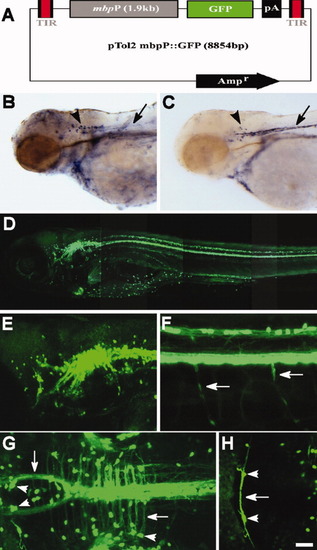
Enhanced green fluorescent protein (EGFP) expression in Tg(mbp:egfp) zebrafish. A: Structure of the pTol2mbp:gfp DNA to drive EGFP expression in oligodendrocytes. B,C: Expression of mbp in wild-type (wt; B) and of egfp in Tg(mbp:egfp) (C) embryos revealed by in situ RNA hybridization at 4 days postfertilization (dpf). Arrowheads and arrows indicate ventral hindbrain and lateral line Schwann cells, respectively. D-H: EGFP expression in 5 dpf Tg(mbp:egfp) zebrafish. D-F: Lateral views of the whole embryo (D), hindbrain (E), and spinal cord (F), dorsal to the top and anterior to the left. Arrows in F indicate EGFP+ Schwann cells. G,H: Dorsal views of the hindbrain, anterior to the left. EGFP expressions were detected in the cell bodies (arrowheads) and processes of oligodendrocytes (arrows). Scale bars = 75 μm in B,C, 100 μm in D, 50 μm in E,H, 25 μm in F,G. |

mbp+ cells are exclusively expressed in oligodendrocytes. A-F: All images are transverse sections of the spinal cord (A-D) and hindbrain (E,F) of 5 dpf Tg(mbp:egfp) zebrafish, dorsal up. A: Labeling with an anti-MBP antibody to mark oligodendrocyte myelin processes. Arrows indicate enhanced green fluorescent protein-positive (EGFP+) cell bodies and arrowheads indicate MBP+, EGFP+ myelin processes. B: Labeling with an anti-Sox10 antibody to mark OPCs and oligodendrocytes. Arrows indicate Sox10+, EGFP+ oligodendrocytes in the white matter and arrowheads indicate Sox10+, EGFP- OPCs in the gray matter. C,D: Labeling with anti-Hu and anti-Blbp antibodies to mark neurons and radial glia, respectively. Arrows indicate EGFP+ oligodendrocytes. E,F: Labeling of hindbrain sections with anti-Sox10 and anti-Hu antibodies to detect oligodendrocytes and neurons, respectively. All EGFP+ cells are Sox10+ and Hu- oligodendrocytes. Scale bar = 20 μm in A-D; 40 μm in E,F. |

Enhanced green fluorescent protein (EGFP) is expressed in the adult Tg(mbp:egfp) zebrafish. A,B: Fluorescence image (A) and combined fluorescence and brightfield image (B) of the same 3-month-old adult Tg(mbp:egfp) zebrafish. Arrows indicate EGFP expression in the spinal cord. |
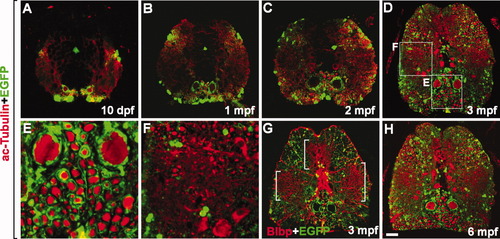
Axon myelination occurs continuously in the spinal cord of postembryonic zebrafish. All images are transverse sections of the spinal cord of Tg(mbp:egfp) zebrafish, dorsal side up. Stages are indicated on each panel. A-F,H: Labeling with anti-acetylated tubulin antibody to mark axons. E,F: High magnification images of boxed areas in D. G: Labeling with anti-Blbp antibody to mark radial glia. Bracketed areas indicate clusters of highly branched radial glial processes. Scale bars = 25 μm in A, 50 μm in B, 80 μm in C, 100 μm in D,G,H, 25 μm in E,F. |