
- Title
-
Expression of protocadherin-19 in the nervous system of the embryonic zebrafish
- Authors
- Liu, Q., Chen, Y., Kubota, F., Pan, J.J., and Murakami, T.
- Source
- Full text @ Int. J. Dev. Biol.
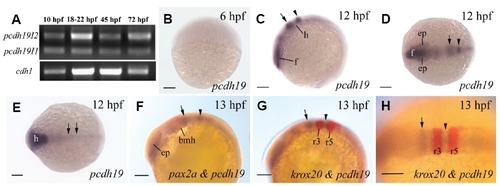
Pcdh19 expression in 6-13 hpf zebrafish embryos. (A) RT-PCR analysis of Pcdh19 isoforms 1 and 2 expression in embryonic zebrafish using total RNAs. RT-PCR for cdh1 was performed as loading control. The remaining panels show whole mount embryos labeled with Pcdh19 cRNA probes (B-E), Pcdh19 and pax2a cRNA probes (F), or Pcdh19 and krox20 cRNA probes (G,H). (B,C) Lateral views of the entire embryos (head towards the lower left corner for C). (D,E) Dorsal views (anterior to the left) of the entire embryos. (F,G) Lateral views of the anterior half of the embryos (anterior to the left and dorsal up), while (H) is a dorsal view of the presumptive hindbrain region of an embryo (anterior to the left). The arrow and arrowhead in (C, D, F, G and H) point to the first and second Pcdh19 expression domains, respectively, in the presumptive hindbrain. The two arrows in panel E indicate Pcdh19 expression in the middle neural keel. Abbreviations: bmh, boundary of the mid- and hindbrains; ep, eye premordium; f, presumptive forebrain; h, presumptive hindbrain; r3 and r5, rhombomeres 3 and 5, respectively. Scale bars, 100 μm. EXPRESSION / LABELING:
|
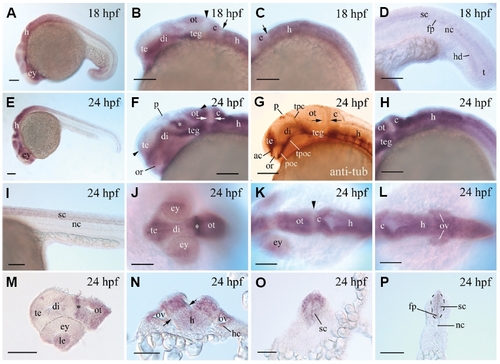
Pcdh19 expression in 18 and 24 hpf zebrafish embryos. (A-F) and (H-L) Whole mount embryos labeled with Pcdh19 cRNA. (G) is the head region of a whole mount embryo labeled with the anti-acytelated tubulin antibody. (A,E) Lateral views of the entire embryos (head towards the lower left corner). (B,F) Lateral views of the fore- and midbrains, while (C,H) are lateral views of the hindbrain (anterior to the left, dorsal up). (J,K,L) Dorsal views of the head region (anterior to the left). (D,I) Lateral views of the posterior half of the body and midtrunk region, respectively (anterior to the left). The arrowhead in (B,K), and the opposing arrows in (F,G) indicate the same region with reduced Pcdh19 expression, located between the posterior border of the optic tectum and boundary of the midhindbrains. The arrow in (B,C) point to the same area with reduced Pcdh19 expression, located immediately posterior to the cerebellum. The asterisk in (F,J,M) points to the same Pcdh19 expressing area in the dorsal thalamus. (M-P) Sections from whole mount embryos processed for Pcdh19 in situ hybridization. The apposing arrowheads in (F) indicate the plane of section for the image in (M) (anterior to the left), while (N-P) are cross sections (dorsal up) at the otic vesicle (ov), anterior-trunk, and mid-trunk regions, respectively. The opposing arrows in (N) indicate a band of tissue with reduced Pcdh19 staining. Other abbreviations: ac, anterior commissure; c, cerebellum; di, diencephalon; fp, floor plate of the spinal cord; h, hindbrain; hc, hair cells; hd, hypochord; le, lens; nc, notochord; or, optic recess; ot, optic tectum; p, pineal organ; poc, postoptic commissure; sc, spinal cord; te, telencephalon; teg, tegmentum; tpc, tract of posterior commissure; tpoc, tract of postoptic commissure. The remaining abbreviations are the same as in Fig. 4. Scale bars,100 μm for (A-M), and 50 μm for (N-P=. EXPRESSION / LABELING:
|
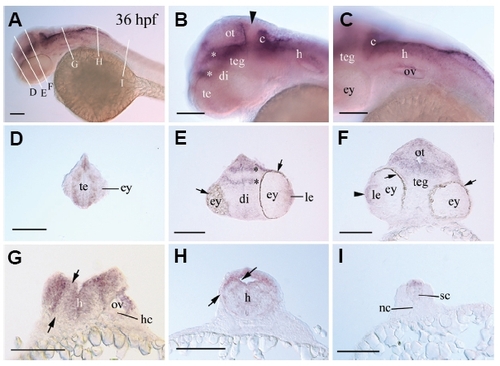
Pcdh19 expression in 36 hpf embryos. (A,B,C) Lateral views of whole mount embryos showing the anterior 2/3 of the fish, the anterior head, and posterior head regions, respectively (anterior to the left and dorsal up). (D-I) Cross sections (dorsal up) from whole mount embryos processed for Pcdh19 in situ hybridization. Levels of the sections are shown in (A). The arrowhead in (B) points to the region with reduced Pcdh19 expression (also see Fig. 5F). Arrows in (E,F) indicate pigmented epithelium. The arrowhead in (F) points to Pcdh19 expression in the epithelial layer of the lens. Asterisks in (B,E) indicate the same thalamic regions with stronger Pcdh19 expression. The opposing arrows in (G,H) indicate the band of tissue with reduced Pcdh19 expression (also see Fig. 5N). Abbreviations are the same as in Fig. 5. Scale bars, 100 μm. EXPRESSION / LABELING:
|
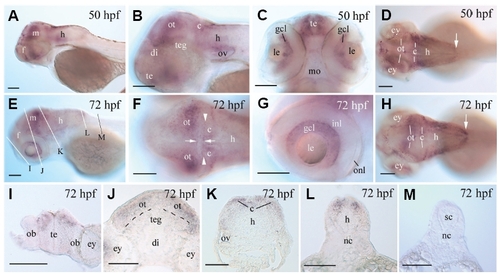
Pcdh19 expression in older embryos. Pcdh19 expression in 50 hpf (A-D) and 72 hpf (the remaining panels) embryos. (A-H) Whole mount embryos showing lateral views (anterior to the left and dorsal up) of the anterior fish (A,E), head (B) and eye (G). (C) Ventral view of the head (dorsal up), while (D,F,H) are dorsal views (anterior to the left). The arrow in (D,H) points to the posterior border of Pcdh19 expression domain in the hindbrain, while the arrowheads in (F) indicate the boundary of the mid-hindbrains. The apposing arrows in (F) indicate the area between the posterior border of the optic tectum and boundary of the mid-hindbrains with reduced Pcdh19 expression. (I-M) Cross sections (dorsal up) with their section levels indicated in (E). The dashed lines in (J) indicate the boundary between the optic tectum and tegmentum. Abbreviations: f, forebrain; gcl, retinal ganglion cell layer; inl, inner nuclear layer; m, midbrain; onl, outer nuclear layer. Other abbreviations are as in Fig. 4. Scale bars, 100 μm. EXPRESSION / LABELING:
|