
- Title
-
Notch-responsive cells initiate the secondary transition in larval zebrafish pancreas
- Authors
- Parsons, M.J., Pisharath, H., Yusuff, S., Moore, J.C., Siekmann, A.F., Lawson, N., and Leach, S.D.
- Source
- Full text @ Mech. Dev.

Secondary islets are established during the first 3 weeks of larval life and are associated with the main pancreatic duct. (A) The results of counting, over time, the occurrence of secondary islets in either Tg(P0-pax6:GFP)ulg515 or Tg(ins:mCherry)jh2 larvae. Starting at 5 days, few larvae display a secondary islet as detected by either transgene. By 20 days almost all larvae have at least one secondary islet. (B) Paraffin section through the pancreas of a 28 dpf, Tg(ptf1a:eGFP)jh1 juvenile following immunofluorescent detection for GFP (green) and insulin (red). The main pancreatic duct can be distinguished as a GFP negative strip of cells running through the middle of the pancreatic tail. Two secondary islets can be seen in the pancreatic tail (↑) closely associated with the duct. Inset is an enlargement of the secondary islet on the left. An isolated β-cell can be seen located right on the duct (◄). (C) Cryosection of adult pancreas lobe from a Tg(ins:nfsB-mCherry)jh5;Tg(P0-pax6b:GFP)ulg515, which includes the principal islet (large arrowhead) and two significant secondary islets (↑). (D–F) Close up of secondary islet (second from the left); (D) bright field image merged with nuclei staining reveals a morphological epithelial duct (outlined by white dotted line). (E) β-Cells can be discerned by red fluorescence and are located in close association of an offshoot of the duct. (F) Pax6b expressing cells are marked green and in a merged image demonstrate endocrine cells adjacent to the duct. (D–F scale bar = 20 μm.) |
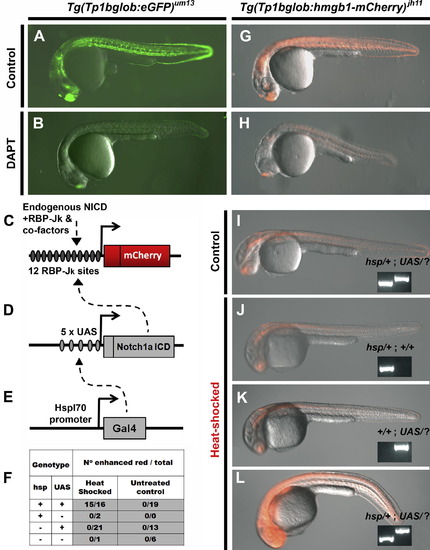
Transgenic zebrafish can report on Notch-signaling activity. The Notch-responsive element was used to generate two transgenic lines Tg(Tp1bglob:eGFP)um14 and Tg(Tp1bglob:hmgb1-mCherry)jh11. In-crossing homozygous animals for both lines gave clutches expressing fluorescent marker in all individuals. Representatives (at 24hpf) for each lines are shown in (A) and (G). Incubation of clutch mates with the Notch-signaling inhibitor, DAPT (100 μM) from 80% epiboly to 24hpf, results in reduction in fluorescent protein (B and H). This demonstrates that inhibiting Notch-signaling concomitantly reduces Tp1 transgene activity. Over-expression of NICD in our red Notch-responsive line was carried out using a Gal4/UAS bipartite system (Scheer and Campos-Ortega, 1999). (C–E) Schematics of the following constructs: (C) Tp1bglob:hmgb1-mCherry, (D) UAS:notch1a-intra and (E) hsp70l:Gal4. In the presence of all three constructs and following heat-shock, the transcriptional activator Gal4 is expressed and transactivates through its upstream-activating site (UAS) (dashed arrow, E), and this directs expression of NICD. This exogenous NICD augments the endogenous NICD (dashed arrow, D), and in concert with RBP-Jκ and co-factors increases activity of the Tp1 element. (F) Progeny from a Tg(Tp1bglob:hmgb1-mCherry; UAS:notch1a-intra; hsp70l:Gal4) x Tg(UAS:notch1a-intra) cross were selected for red fluorescence and then either heat-shocked or kept as a control. Six hours later embryos were scored for red fluorescence that was enhanced above that seen for controls. All embryos were then genotype for presence of hsp70l:Gal4 (hsp) and UAS:notch1a-intra (UAS) transgenes. As can been seen in (F) and the examples shown in (I-L), enhanced red fluorescence is dependent on heat-shock and possession of both the Gal4 and UAS transgenes (inset panel shows genotyping, UAS/? Refers to either UAS/UAS or UAS/+). Together these results indicate that over-expression of NICD augments expression from the Tp1 element. Exposure time used to record fluorescence images was constant in A and B, G and H and for I-L. |
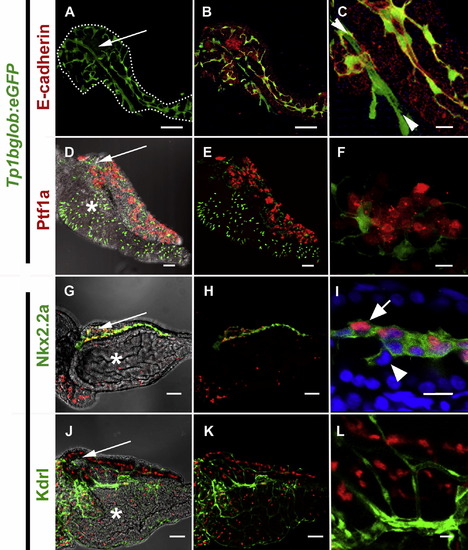
The localization of pancreatic Notch-responsive cells in the 5 dpf zebrafish pancreas as imaged by confocal microscopy. (A, B, D, E, G, H, J, K) Low power images to see the whole developing organ, outlined (white dots) in (A) (scale bars = 50 μM). (D, G, J) Brightfield merged images allows visualization of pancreas oriented so that the pancreas lies on top of the intestinal bulb (white *) with the principal islet (white →) and head of the pancreas on the left, and the tail of the pancreas on right. (C, F, I, L) High magnification shows detailed cellular structure (scale bars = 10 μM). (A–F) Images of micro-dissected pancreata from Tg(Tp1bglob:eGFP)um14 larvae; PNCs can be visualized as green due to cytoplasmic GFP. GFP positive PNCs can be detected through out the pancreas (A) and immunofluorescent staining to detect E-cadherin (red) indicates vast majority of PNCs are epithelial in nature (B and C). At higher mag. (C), Notch-responsive cells that are E-cad negative can also be seen (►◄). These cells represent endothelium of the early pancreatic, arterial blood supply. (D–F) Tg(ptf1a:Gal4VP16)jh16; Tg(T2KUAS:nfsB-mCherry)jh17 larvae express red fluorescence in a mosaic fashion in the developing exocrine pancreas. The domain of ptf1a driven red fluorescence is exclusive of PNCs. (G–L) Images of micro-dissected pancreata from Tg(T2KTp1bglob:hmgb1-mCherry)jh11, larvae; nuclei in PNCs can be visualized in red. (G–I) Tg(-3.5kbnkx2.2:GFP)ia3 larva expressing green fluorescence in a cell type previously reported to be pancreatic ducts. (I) Some but not all GFP expressing cells are also responding to Notch-activity. (J–L) Tg(kdrlG-RCFP)zn1 larva expressing green fluorescence in the vasculature. With the exception of the same artery imaged in (C), all endothelium is Notch non-responsive. |
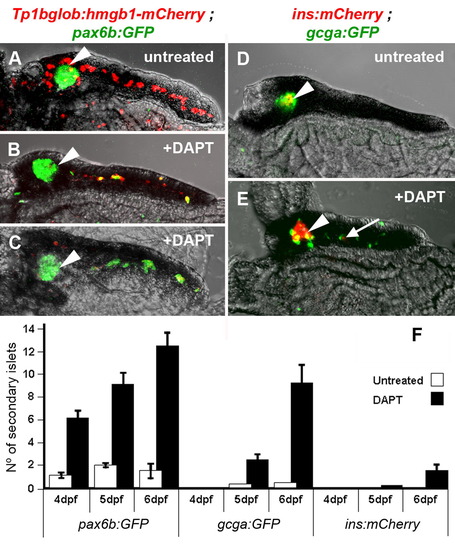
Inhibition of Notch-signaling dramatically induces precocious secondary islet formation. (A–E) Confocal images of 5 dpf micro-dissected pancreata. (A) Tg(Tp1bglob:hmgb1-mCherry)jh11; Tg(P0-pax6b:GFP)ulg515 untreated larva display pax6b expressing cells (green) localized only to the principal islet (◄), and PNCs (red) around the islet and through the middle of the pancreatic tail. (B and C) The same compound transgenic larvae, when treated with 100 μM DAPT from 3 dpf to 5 dpf, show a dramatic loss of PNCs concurrent with the appearance of Pax6b endocrine cells along the pancreatic tail. (B) Represents a typical result and (C) an extreme example. (D) Tg(T2Kins:mCherry)jh2; Tg(gcga:GFP)ia1 larva show a principal islet containing β-cells (red) surrounded by α-cells (green). (E) DAPT treatment causes appearance of numerous α- and a few β-cells (→) along the tail of the pancreas. (F) Larvae of transgenic lines that mark early pan-endocrine cells [Tg(P0-pax6b:eGFP)ulg515], α-cells [Tg(gcga:GFP) ia1] and β-cells [Tg(T2Kins:mCherry)jh2] were examined at three time points for the number of secondary islets. By treating with 100 μM of DAPT, significantly more secondary islets were observed. Within either the treated or untreated groups, more pax6b expressing islets were observed, and at an early development time, than either other marker. The marker for β-cells was the most infrequently observed. |

Electromicrographs of transverse sections through the 10 dpf larval pancreas. (A) At low power the whole transverse section of the pancreas appears triangular. Large nuclei and zymogen granules characterize acinar cells of the exocrine pancreas. Right in the middle of the pancreas the lumen of the pancreatic duct can be seen ({, scale bar = 10 μm). (B) Close up of lumen region in (A). Three cells can be seen around the circumference of the lumen (scale bar = 1 μm). (C) These duct localized cells have projection into the lumen. Wherever the cell membranes of these cells are in direct contact with each other, distinctive tight junctions are observed (►, scale bar = 500 nm). (D) Immunoelectron microscopy using a gold conjugated secondary to detect GFP protein in a pancreas of a Tg(Tp1bglob:eGFP)um14 larva (scale bar = 500 nm). The ultra-structure appears slightly different due to changes in fixation to permit immunolabelling. Gold particles appear very dark and circular (see inset enlargement) and are detected throughout the cells lining the duct. These cells are morphologically similar and in the same position as the cells previously observed by EM. This demonstrates that the previously described PNCs are located in the lining of the pancreatic duct. |
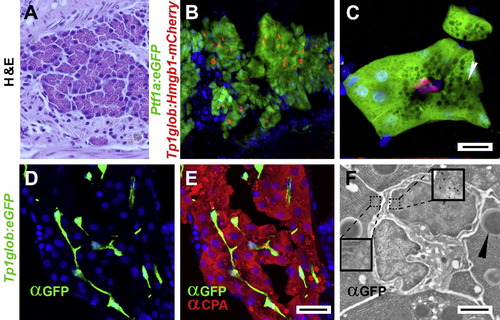
Notch-responsivity marks centroacinar cells in adult zebrafish pancreas. (A) H & E stained sectioned from an adult zebrafish pancreas, demonstrating very similar histology to mammalian pancreas. (B and C) Confocal images of adult pancreata from Tg(ptf1a:eGFP)jh1; Tg(Tp1bglob:hmgb1-mCherry)jh11 fish. Acinar cells are easily identified by ptf1atransgene expression (green). The nuclei of PNCs are marked by red fluorescence. (C) High mag image of a single acinus. Apically localized zymogen granules (white arrowhead) appear as dark circles due to exclusion of GFP. The apical surface of the acinar cells surround three red nuclei of PNCs. Due to their location in the adult pancreas and their Notch responsivity, these cells are definitive centroacinar cells (scale bars = 10 μm). (D–F) Images from adult Tg(Tp1bglob:eGFP)um14 pancreata. (D and E) Confocal images of immunofluorescent detection for GFP (green) and Carboxypeptidase A (CPA, red) performed on longitudinal cryo-sectioned pancreas (scale bars = 20 μm). (F) Immunogold detection of GFP on section through an acinus of Tg(Tp1bglob:eGFP)um14 adult pancreas. EM clearly shows two centroacinar cells with irregular nuclei, surrounded by acinar cells (characterized by the presence of zymogen granules (►). Gold particles are localized to the centroacinar cells (see right inset enlargement to see gold particles) but not acinar cells (see left inset). Scale bar = 2 μm). (B–E) Nuclei are stained blue with Hoechst. |
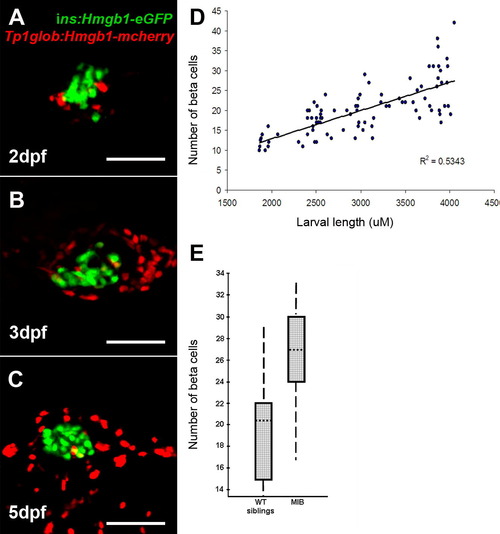
Quantification of β-cells in the principal islet, and the effects of Notch inhibition. (A–C) islet confocal images from Tg(T2Kins:hmgb1-eGFP; T2KTp1bglob:hmgb1-mCherry) larvae. Pictures generated from multiple optical sections rendered to a single image. Very few PNCs (red nuclei) are associated with the β-cells of the principal islet (green nuclei). No cells were detected that were double positive. (D) Results of measuring larvae and then imaging the head of the pancreas to count β-cell number. Following confocal Z-section analysis through the islet, the number of GFP positive nuclei was plotted against larval length. The graph demonstrates that β-cell number increases with larval size. The same β-cell counting approach was taken with ins:hmgb1-eGFP larvae that were homozygous for the mibta52b (-/-) mutation or phenotypically wildtype (wt) clutch mates (-/+ and +/+). Pancreata from mib and wt larvae were collected at 48 and 72hpf, dissected and imaged by confocal microscopy. β-Cell number for the 2 time points were combined for each group (wt and mib) as there has no significant change in number within each group over this time period (48–72hpf). Comparison of β-cell number in mib (mean = 26.1, n = 10) and wt (20.0, n = 10) is shown in a box plot (E). Boxes represent 50% of the data, with the median marked as a dotted line. The vertical lines represent the whole data range. With mib dependent Notch inhibition, there is a statistically significant, but less than dramatic, effect on β-cell number (ANOVA, p = 0.0123). [Note, when the data from the 2 time points used was not combined, there was still significant increase in β-cells at either 48 hpf (p = 0.048) and 72 hpf (p = 0.033).] This confirms that Notch inhibition, via the mib mutation, leads to increased number of β-cells in the principal islet. |
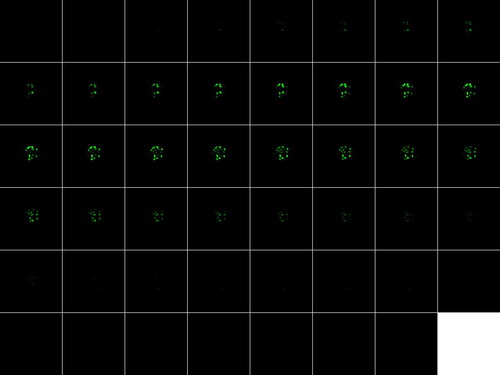
In order to count β-cells in the principal islet, we used the tg(ins:hmgb1-eGFP) transgenic line that expresses eGFP in the nuclei only. This allows the visualization of individual nuclei surrounded by a negative cytoplasm. The whole principal islet is between 45–50 μM thick and we imaged 2 μM Z-sections through the islet. In this way each nuclei is captured on multiple sections. Each section was magnified and projected onto paper. By outlining each nucleus, a detailed record of the number of GFP positive nuclei could be recorded. |
Reprinted from Mechanisms of Development, 126(10), Parsons, M.J., Pisharath, H., Yusuff, S., Moore, J.C., Siekmann, A.F., Lawson, N., and Leach, S.D., Notch-responsive cells initiate the secondary transition in larval zebrafish pancreas, 898-912, Copyright (2009) with permission from Elsevier. Full text @ Mech. Dev.