
- Title
-
Neuroendocrine transcriptional programs adapt dynamically to the supply and demand for neuropeptides as revealed in NSF mutant zebrafish
- Authors
- Kurrasch, D.M., Nevin, L.M., Wong, J., Baier, H., and Ingraham, H.A.
- Source
- Full text @ Neural Dev.
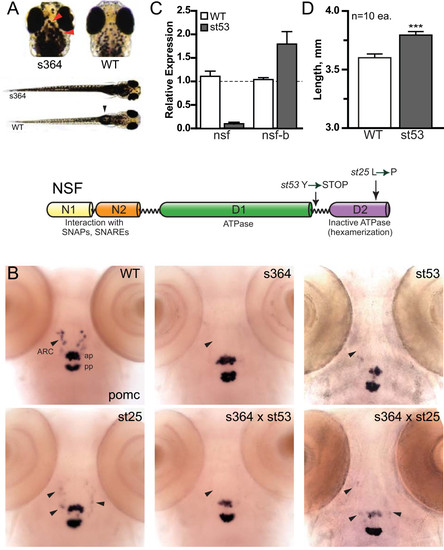
The s364 phenotype is due to mutation in nsf. (A) Mutant and wild-type (WT) zebrafish (5 dpf) are shown on a white background. Mutant zebrafish display a dark appearance on the white background from dispersed melanin (red arrowhead). Wild-type zebrafish have an inflated swim bladder (black arrowhead) but mutant zebrafish do not. (B) Loss of pomc expression in the arcuate nucleus (ARC) of the hypothalamus (arrowheads) of mutant alleles but not wild-type at 5 dpf is shown. pomc expression is maintained in the anterior pituitary (ap) and posterior pituitary (pp) in both wild-type and mutant alleles. s364/st53 or s364/st25 transheterozygotes display the same pomc phenotype as s364, st53, and st25 homozygotes. Images are representative of at least three independent crosses of fifteen or more fish each. (C) Relative transcript levels are shown for nsf and nsfb in wild-type and st53 zebrafish heads at 5 dpf (n = 8 each). Fold induction is relative to one wild-type head for each primer set and taken to be 1.0 (horizontal dashed line). All other samples, including additional control and experimental samples, are normalized to this one wild-type sample with variation shown by error bars (standard error of the mean). (D) The linear growth of 5 dpf wild-type or st53 zebrafish is shown (wild-type = 3.6 mm, st53 = 3.8 mm; n = 10 each group). Length was measured from nose to tip of tail. Wild-type fish were temporarily paralyzed using ice. Results are expressed as mean ± standard deviation, and statistical analyses were done by unpaired t-test. ***P < 0.001. A schematic representation of NSF protein motifs. The st53 mutation introduces a nonsense mutation just prior to D2, whereas st25 introduces a missense mutation in D2. Two distinct amino-terminal domains (N1, N2) mediate substrate recognition. PHENOTYPE:
|
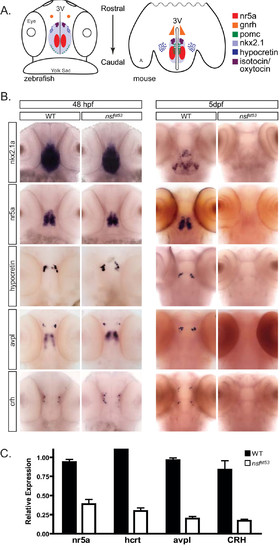
Loss of hypothalamic markers occurs during embryo-to-larva transition. (A) Cartoon depicting the spatial patterning of known hypothalamic markers in the zebrafish (48 hpf) and mouse (P0) brain. A dorsal view, ventral side down is shown for zebrafish and a horizontal plane is shown for mouse of several conserved hypothalamic transcription factors and neuropeptides. Other anatomical landmarks include the eyes, yolk sac, third ventricle (3V), and on the mouse cartoon, amygdala (A), (B) Whole mount expression patterns are shown for nkx2.1a, nr5a (ff1d), hcrt, avpl, and crh for both 48-hpf (n = 15) and 5-dpf (n = 20) wild-type (WT) and nsfst53 zebrafish. The expression of hypothalamic markers is lost by 5 dpf (right panel). The 48-hpf nsfst53 zebrafish were identified by genotyping. (C) Relative transcript levels of neuroendocrine markers are shown in wild-type and nsfst53 zebrafish heads at 5 dpf (n = 8 each). Fold induction is relative to 1.0 with results from a single wild-type head chosen for each primer set. Samples variation is shown by error bars (standard error of the mean). |

gnrh3 transcripts persist and protein levels are normal in nsfst53 zebrafish. Whole-mount in situ hybridization for gnrh3 expression in the olfactory placode in 5 dpf wild-type (WT) and nsfst53 control or morpholino-injected larva is shown (top panels). Immunocytochemistry for GnRH peptide levels is shown (bottom panels). Images are representative of at least four animals per genotype per treatment. Anatomical landmarks include the olfactory epithelium (OE) and the eye. EXPRESSION / LABELING:
|

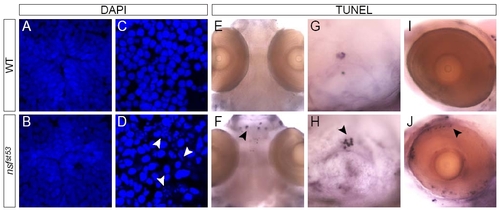
nsfst53 hypothalamus undergoes normal development and does not appear to initiate apoptosis. Apoptosis in (A) wild-type (WT) and (B) nsfst53 5 dpf zebrafish (12 μm horizontal sections) is shown. Cell death is not observed in the hypothalamus (B), but is observed in olfactory terminals (B, white arrowhead). Photoreceptor auto-fluorescence in wild-type zebrafish is lost in mutant (B, white arrow). DAPI staining of wild-type (A, C, E) and nsfst53 zebrafish (B, D, F) at 5 dpf is shown. Immunocytochemistry for (C, D) Hu family proteins and (E, F) SV2 are shown for wild-type and nsfst53 5 dpf zebrafish. All images are representative of at least 15 animals assayed. (G-I) Electron microscopy images from nsfst53 hypothalamic sections (n = 3). Cell bodies (G) and vesicle-filled synapse (H) resemble wild-type neurons (data not shown). Anatomical landmarks and (I) the presence of dark-cored secretory vesicles (red arrowhead) were used to confirm the location of the hypothalamus. N = nucleus. Note that the medially located cell bodies (Figure 4C, D, G) are framed on either side by lateral projections (Figure 4E, F, H) in both cryosection and EM images. EXPRESSION / LABELING:
|

Accumulated neuropeptide protein and the buildup of endoplasmic reticulum-like membranes in nsfst53 zebrafish. The levels of (A, B) hypocretin and (C, D) NPY protein in wild-type (WT) and nsfst53 zebrafish are shown (n = 8 each). Protein levels are increased in the soma (B, D). DAPI stained nuclei are also shown (A-D). Electron microscopy images from (E) wild-type and (F) nsfst53 zebrafish (n = 3 each). For EM analysis, neuroanatomical landmarks (obtained from [50]) and the presence of dense-core vesicles (Figure 4I) were used to locate the hypothalamus. The budding of secretory vesicles from the trans-Golgi network is highlighted (E, red arrowhead). A build up of ribosome-bound ER-like membranes in nsfst53 zebrafish is noted (F, red arrowhead). PM = plasma membrane. |
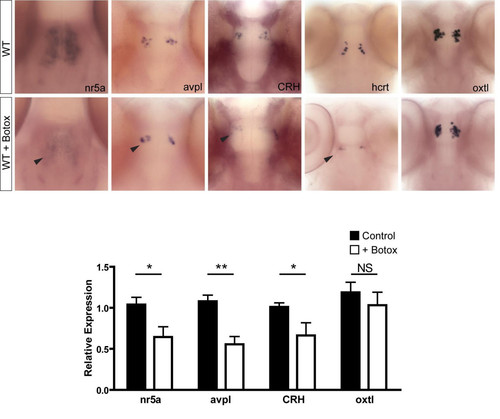
Injection of botulinum toxin B into wild-type zebrafish mimics the nsfst53 phenotype. Whole-mount in situ hybridization for wild-type (WT) and WT + botox at 5 dpf is shown (n = 4 each). The expression of neuroendocrine markers in botox-injected WT fish is highlighted (black arrowheads). Relative transcript levels are shown for the heads of WT and WT + botox at 5 dpf (n = 8 each). Fold induction is relative to one control sample and taken to be 1.0. All other samples, including additional control and experimental samples, are normalized to this one wild-type sample. Sample variation is shown by error bars (standard error of the mean). Statistical analyses were done by unpaired t-test. *P < 0.05; **P < 0.01. NS = not significant. EXPRESSION / LABELING:
|

oxytocin-like is downregulated in nsfst53 zebrafish following an acute osmolar challenge. (A) Whole-mount in situ hybridization in 5 dpf wild-type (WT) and nsfst53 control or morpholino-injected zebrafish (top panels) or following 24 h 10x salt treatment (middle panel) is shown. The decrease in expression of oxytocin-like (oxtl) in nsfst53 zebrafish exposed to 10x salt is noted (black arrow). TUNEL-positive cells around the gills in nsfst53 zebrafish following 10x salt treatment are shown (black arrowhead). Images are representative of at least four animals per genotype per treatment. The salt challenge was repeated twice. (B) Relative transcript levels are shown for oxtl in wild-type and nsfst53 zebrafish heads at 5 dpf, with or without 10x salt exposure (n = 8 each). Fold induction is relative to one control sample and taken to be 1.0. All other samples, including additional control and experimental samples, are normalized to this one wild-type sample. Variation in samples is shown by error bars (standard error of the mean). Statistical analyses were done by unpaired t-test. *P < 0.05. EXPRESSION / LABELING:
|

Loss of hypothalamic markers occurs during embryo-to-larva transition. Whole-mount expression patterns are shown for pomc (top panels) and hcrt (bottom panels) in 72hpf, 4dpf, and 5dpf WT and nsfst53 zebrafish (n≥15 per timepoint). Progressive loss of transcripts are noted (black arrowheads). |

Transcript and protein levels are equal in other brain regions (A-D) and in hypothalamic catecholamine neurons (E-F) in WT and nsf mutant 5dpf larvae. (A-D) Whole-mount expression patterns are shown for pomc (A-B) and emx (C-D) in WT and nsfst53 zebrafish (n≥8 per marker per genotype). Maintained expression of pomc in nsf mutant pituitary is noted (black arrowhead). (E-F) Tyrosine hydroxylase protein levels in hypothalamic neurons is shown in sectioned WT and nsfst53 zebrafish (n=7 ea). Cell bodies are shown with DAPI stain. |

nsfst53 hypothalamic neurons do not appear to undergo apoptosis. (A) Lateral view of a whole-mount ISH for nsf in WT zebrafish during the embryo-to-larva transition is shown. (B) Apoptosis in wild type and nsfst53 zebrafish (lateral view, middle panels; dorsal view at the hypothalamus, bottom panels) fixed at 24 hour intervals during the embryo-to-larva transition is shown. Images are representative of at least two experiments; n=5 per genotype per timepoint. |
Cell death is observed in sensory neurons in nsf mutant larvae. DAPI stain in the hypothalamus (A, B) and the posterior tuberculum of wild type and nsfst53 sectioned (12 μm horizontal sections) 5dpf zebrafish is shown. Morphological changes associated with cell death, such as cell asymmetry and chromatin condensation is noted (white arrowheads; D). Cell death is not observed in the hypothalamus (A,B), but is observed in olfactory terminals (F), otic capsule (H) and photoreceptor cells (J) of mutant zebrafish. Images representative of duplicate experiments, n≥5 per genotype. |

npy transcripts are absent but NPY protein is accumulated in nsf mutant larvae. Whole-mount staining for npy expression and immunocytochemistry for NPY protein in wild type and nsfst53 5dpf zebrafish is shown (n=5 per experiment per genotype). Loss of transcript (black arrowhead) is noted. The contrast between the decreased NPY levels in peripheral projections (white arrowhead) but accumulation of NPY in the soma of nsf mutant zebrafish and the levels observed in WT is highlighted. |

Unillustrated author statements PHENOTYPE:
|