
- Title
-
Foxd3 Controls Melanophore Specification in the Zebrafish Neural Crest by Regulation of Mitf
- Authors
- Curran, K., Raible, D.W., and Lister, J.A.
- Source
- Full text @ Dev. Biol.

mitfa:gfp transgenic reports mitfa positive melanoblasts. (A) Live GFP expression from 20 hpf mitfa:gfp transgenic zebrafish, streams of migratory neural crest cells arise from lateral stripes, dorsal view, anterior left, 10x. hb = hindbrain. (B) Live GFP expression from 26 hpf mitfa:gfp transgenic zebrafish, mitfa positive neural crest cells migrate ventrally (mv), lateral view, anterior left, 10x. (C, E) mitfa:gfp transgenic recapitulates mitfa expression, dorsal view, anterior left, 24 hpf. Green: GFP expression, red: mitfa mRNA. (C) 20x scale bar = 20 μm. (E) 40x scale bar = 10 μm. 98.4% of mitfa:gfp cells (n = 311) are mitfa positive. (D, F) mitfa:gfp transgenic labels early melanoblasts, dorsal view, anterior left, 24 hpf. Green: GFP expression, Red: dct. (D) 20x. Scale bar = 20 μm. (F) 40x. Scale bar = 10 μm. Arrow points to mitfa:gfp positive cell that has yet to activate dct expression. 55% of mitfa:gfp positive cells (n = 193) are dct positive. EXPRESSION / LABELING:
|
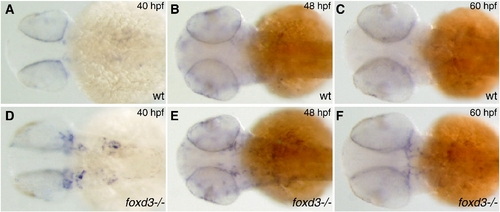
mitfa expression expanded in Foxd3 mutant. mitfa mRNA expanded in head and anterior trunk of Foxd3 mutant. Dorsal view, anterior left, 5x. (A–C) mitfa expression in wild-type zebrafish (D–F) mitfa expression in foxd3-/- (sym1). (A, D) 40 hpf (B, E) 48 hpf (C, F) 60 hpf. |
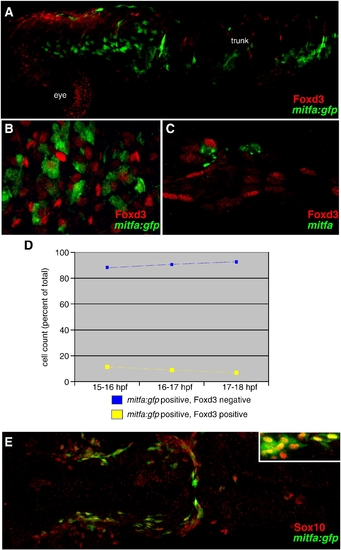
Foxd3 and mitfa expressed in separate populations of neural crest cells. (A) mitfa:gfp positive neural crest cells are mutually exclusive with Foxd3 positive cells, 18 hpf, lateral view, anterior left, 10x. (B) mitfa:gfp up-regulates in Foxd3 negative neural crest cells, 18 hpf, dorsal view, anterior trunk region, 20x. (A, B) Red: Foxd3 Ab. Green: GFP expression in mitfa:gfp transgenic line (C) mitfa up-regulates in Foxd3 negative neural crest cells, 24 hpf lateral view, anterior trunk region. Red: Foxd3 Ab. Green: mitfa mRNA. 20x. (D) Cell counts of mitfa:gfp positive cells derived from 40x confocal images of migratory neural crest cells at three time points: 15–16 hpf, 16–17 hpf and 17–18 hpf. Blue line = percent of total mitfa:gfp positive cells counted which are Foxd3 negative. Yellow line = percent of total mitfa:gfp positive cells counted which are Foxd3 positive. Stage 15–16 hpf, 88% of mitfa:gfp positive cells are Foxd3 negative (583/664); 12% of mitfa:gfp positive cells are Foxd3 positive (81/664). Stage 16–17 hpf, 89% of mitfa:gfp positive cells are Foxd3 negative (497/560); 11% of mitfa:gfp positive cells are Foxd3 positive (63/495). Stage 17–18 hpf, 91% of mitfa:gfp positive cells are Foxd3 negative (448/495); 9% of mitfa:gfp positive cells are Foxd3 positive (47/495). (E) mitfa:gfp positive neural crest cells overlap with Sox10 expression, 91.8% of 250 mitfa:gfp positive cells are Sox10 positive, 20 hpf, dorsal view, anterior left, 10x (inset 20x). EXPRESSION / LABELING:
|

foxd3 expression is absent in melanophores, but present in iridophores and xanthophore precursors. (A, B) foxd3:gfp maintains expression in xanthoblasts, 27 hpf, dorsal view, anterior left. Green: anti-GFP, red: Pax3/7 (mouse DP312 Ab). 94% of Pax3/7 xanthoblasts (n = 165) are foxd3:gfp positive. (A) 20x, scale bar = 40 μm. (B) 40x, scale bar = 7.5 μm. (C, D) foxd3:gfp maintains expression in iridophores, 72 hpf, lateral view, dorsal stripe, anterior left. Scale bar = 25 μm. 88.3% of differentiated iridophores (n = 342) are foxd3:gfp positive. (C) Incident light reveals 4 iridophores. (D) Green: live foxd3:gfp. (E, F) foxd3:gfp expression absent in melanophores, 72 hpf, lateral view, yolk ball, anterior left, embryo treated with PTU. Arrows: partially melanized melanophores, scale bar = 90 μm. 5% of melanophores (n = 314) express foxd3:gfp. (E) Brightfield. (F) Green: live foxd3:gfp. EXPRESSION / LABELING:
|

Melb-a cell culture analysis displays Foxd3 repression of endogenous MITF expression. (A, B) Transfected melb-a (mouse melanoblast) cells, (20x). Red: anti-MITF rabbit polyclonal, green: anti-Myc mouse monoclonal. (A) Cells transfected with full-length zebrafish foxd3-myc sequence show nuclear exclusion of endogenous mouse MITF. (B) Cells transfected with DNA-binding mutant version of zebrafish foxd3-myc display co-localized staining with endogenous mouse MITF. (C) Cell counts collected from 5 separate transfection experiments. 56 melb-a cells transfected with full-length foxd3 became MITF negative, 2 remained positive. 1 melb-a cell transfected with DNA-binding mutant version of zebrafish foxd3 became MITF negative, 45 transfected cells remained positive. |

Foxd3 represses the mitfa promoter in zebrafish embryos. (A–H) One-cell mitfa:gfp transgenic zebrafish embryos microinjected with mRNA and imaged live at 6–7 hpf, shield stage 5x. (A, C, E, G) Brightfield images. (B, D, F, H) Green: live GFP expression from mitfa:gfp. (A, B) Un-injected embryos reveal no fluorescence at shield stage (observed in 64/64 embryos). (C, D) Embryos injected with sox10 mRNA produce robust, precocious mitfa:gfp expression at shield stage (observed in 62/64 embryos). (E, F) Co-injection of full-length foxd3 with sox10 mRNA prevents mitfa:gfp expression at shield stage (observed in 47/52 embryos). (G, H) Embryos co-injected with sox10 and DNA-binding mutant version of foxd3 mRNA display a return to robust, precocious mitfa:gfp expression at shield stage (observed in 43/49 embryos). |
Reprinted from Developmental Biology, 332(2), Curran, K., Raible, D.W., and Lister, J.A., Foxd3 Controls Melanophore Specification in the Zebrafish Neural Crest by Regulation of Mitf, 408-417, Copyright (2009) with permission from Elsevier. Full text @ Dev. Biol.