
- Title
-
Promoter analysis of ventricular myosin heavy chain (vmhc) in zebrafish embryos
- Authors
- Jin, D., Ni, T.T., Hou, J., Rellinger, E., and Zhong, T.P.
- Source
- Full text @ Dev. Dyn.
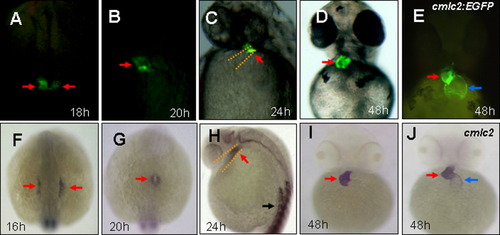
Spatial and temporal expression of vmhc:EGFP in zebrafish embryos. A-E: Fluorescent optics revealing expression of vmhc-EGFP in the lateral plate mesoderm (A), the cardiac cone (B), the ventricular portion of the heart tube (C), and the ventricle (D) in Tg[vmhc:EGFP] embryos, as well as cmlc2-EGFP expression in the ventricle and the atrium in Tg[cmlc2-EGFP] embryos (E). F-J: Whole-mount in situ analysis showing expression of vmhc in the lateral plate mesoderm (F), the cardiac cone (G), the ventricular portion of the heart tube (H), and the ventricle (I), as well as cmlc2 expression in both cardiac chambers (J). Dorsal views with anterior to the top (A,B,F,G). Lateral views (C,H). Ventral views (D,E,I,J). Red arrows, Ventricular myocytes; blue arrows, Atrial myocytes; black arrows, somites. EXPRESSION / LABELING:
|
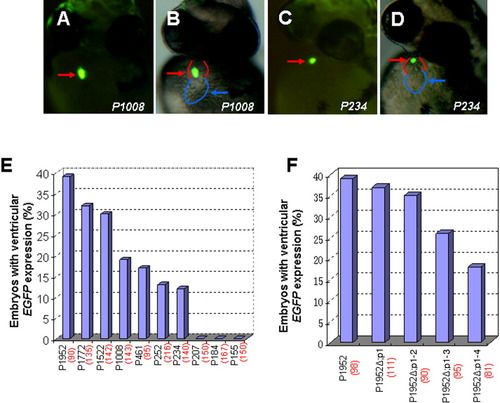
Effects of vmhc promoter deletions on transgene EFFP expression in the ventricle. A-D: Embryos injected with a series of distal promoter deletion constructs at one- or two-cell stages were examined for transient EGFP expression at 48 hpf using fluorescent microscopy. Fluorescent optics showing ventricular EGFP expression in embryos injected with P1008 (A, B) and reduced EGFP expression in embryos with P234 injection (C, D). Reduced EGFP fluorescence typically correlates with a smaller vmhc promoter. Red and blue lines sketch the ventricle and atrium, respectively. E: Bar graph showing percentages of embryos that express EGFP in the ventricle in microinjection of each deletion construct. F: Bar graph depicting percentages of ventricular EGFP-expressing embryos injected with Prx2/S8-deletion constructs (P1952 Δp1, P1952 Δp1-2, P1952 Δp1-3, P1952Δ p1-4). The total number of embryos injected with each construct is shown in parentheses. Ventral views (A-D). |

vmhc promoter deletions caused ectopic EGFP expression in the atrium. A-D: Fluorescent optics revealing the ectopic EGFP expression in the atrium and its normal ventricular expression in embryos with P1522 injection (A,B), as well as reduced EGFP expression in both chambers with P461 injection (C,D). Red and blue lines sketch the ventricle and atrium, respectively. E: Bar graph showing the percentage of embryos that express EGFP in the ventricle (blue) or the atrium (magenta) in embryos injected with each construct. The total number of embryos injected with each construct is shown in parentheses. The ventricular expression data is the same as Figure 3. |

mef2a and prrx1b knockdown reduced transgene EGFP expression. A-D: Lateral view showing reduced EGFP expression in embryos injected with mef2a-MO and prrx1b-MO (B,D), when compared to embryos injected with control morpholinos (A,C). Red arrows, ventricle; blue arrows, atrium. E,F: Bar chart depicting relative EGFP expression folds in mef2a and prrx1b morphants versus control embryos injected with mismatched morpholinos. Three independent experiments were conducted. Error bars indicate standard deviation, and asterisks indicate statistical significance between morphant and control embryos (P < 0.01). G: Schematic graph depicting the prrx1b gene structure and the inhibitory splicing donor site targeted by prrx1b-MO. Red bar, prrx1b morpholinos; red arrowhead, stop codon; black arrow, sequence primers. EXPRESSION / LABELING:
|